Diamond Patterns: Rare Reversal Signals Guide
Master rare but powerful diamond patterns for major reversal signals with 60-65% success rates
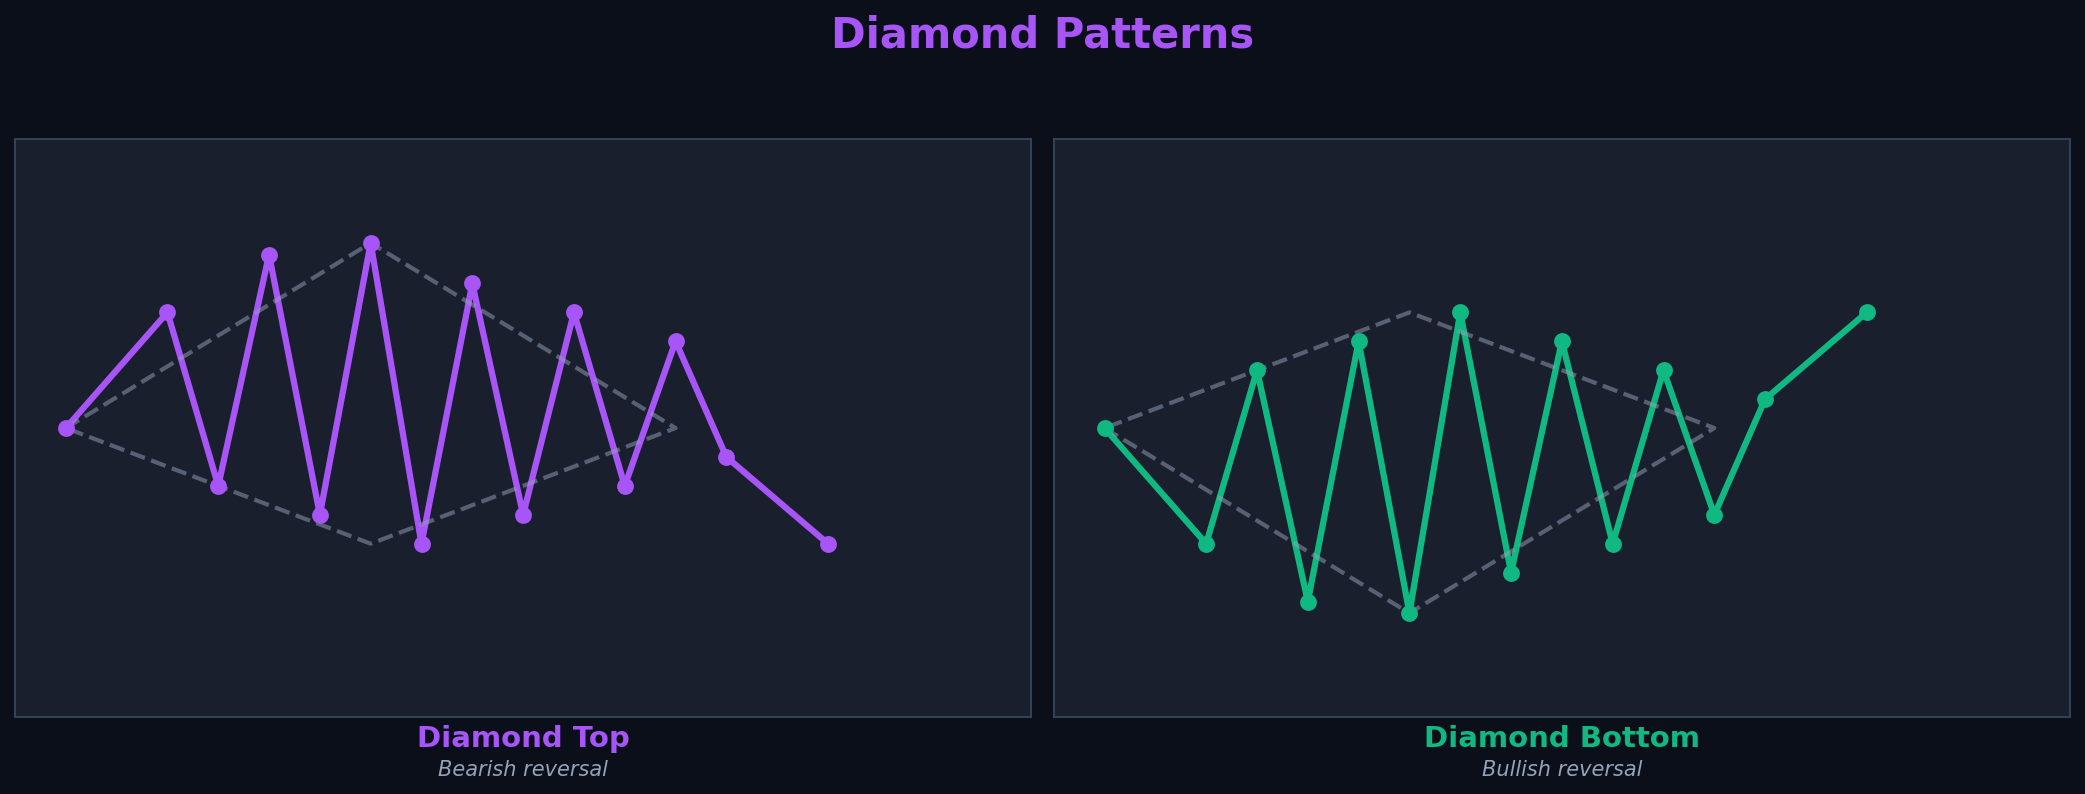
Diamond top and bottom patterns for major reversals
Understanding Diamond Patterns
Diamond patterns are rare reversal formations that combine expanding and contracting price action, creating a diamond shape. They form at major tops and bottoms, signaling significant trend changes. The pattern shows initial volatility expansion followed by contraction before the reversal. Due to their rarity and complexity, they're powerful signals when properly identified.
💡 Success Rate
Diamond patterns: 60-65% reversal success. Rare but powerful at major turning points. Best with volume confirmation.
Diamond Top (Bearish)
Pattern Structure
- Expanding Phase: Widening price swings (left half)
- Contracting Phase: Narrowing price swings (right half)
- Shape: Diamond or rhombus formation
- Duration: 2-4 months typical
- Breakdown: Below support line with volume
Trading Strategy
Entry: Sell/short on close below diamond support
Stop Loss: Above diamond high
Target: Measure diamond height, subtract from breakdown
Volume: Should increase on breakdown
Success Rate: 60-65% reach target
Diamond Bottom (Bullish)
Pattern Structure
- Expanding Phase: Widening price swings downward
- Contracting Phase: Narrowing price swings upward
- Shape: Inverted diamond formation
- Duration: 2-4 months typical
- Breakout: Above resistance line with volume
Trading Strategy
Entry: Buy on close above diamond resistance
Stop Loss: Below diamond low
Target: Measure diamond height, add to breakout
Volume: Should increase on breakout
Success Rate: 60-65% reach target
Key Takeaways
- Diamond patterns are rare reversal signals (60-65% success)
- Diamond top: bearish reversal at major tops
- Diamond bottom: bullish reversal at major bottoms
- Structure: expanding phase then contracting phase
- Duration: 2-4 months typical formation time
- Volume increases during expansion, decreases during contraction
- Target: measure diamond height, project from breakout
- Rare pattern—only forms at major turning points
- Requires clear diamond shape for validity
- Always use stops: opposite side of diamond
Conclusion
Diamond patterns are rare but powerful reversal signals that form at major market turning points. Their unique structure of expanding then contracting volatility makes them distinctive. When properly identified with volume confirmation, they provide excellent risk-reward opportunities for catching major trend changes.
You've completed the chart patterns series!
Review head and shoulders and double tops/bottoms for more reversal patterns. Explore candlestick patterns to combine with chart patterns.
Related Patterns
Ready to Put This Into Practice?
Join MarketDly to access real-time market insights, AI-powered analysis, and professional trading tools.
No credit card required • Free tier available • Upgrade anytime