Three-Candle Patterns: Most Powerful Reversal Signals
Master the ultimate reversal patterns: morning star, evening star, three white soldiers, and three black crows for high-probability trades
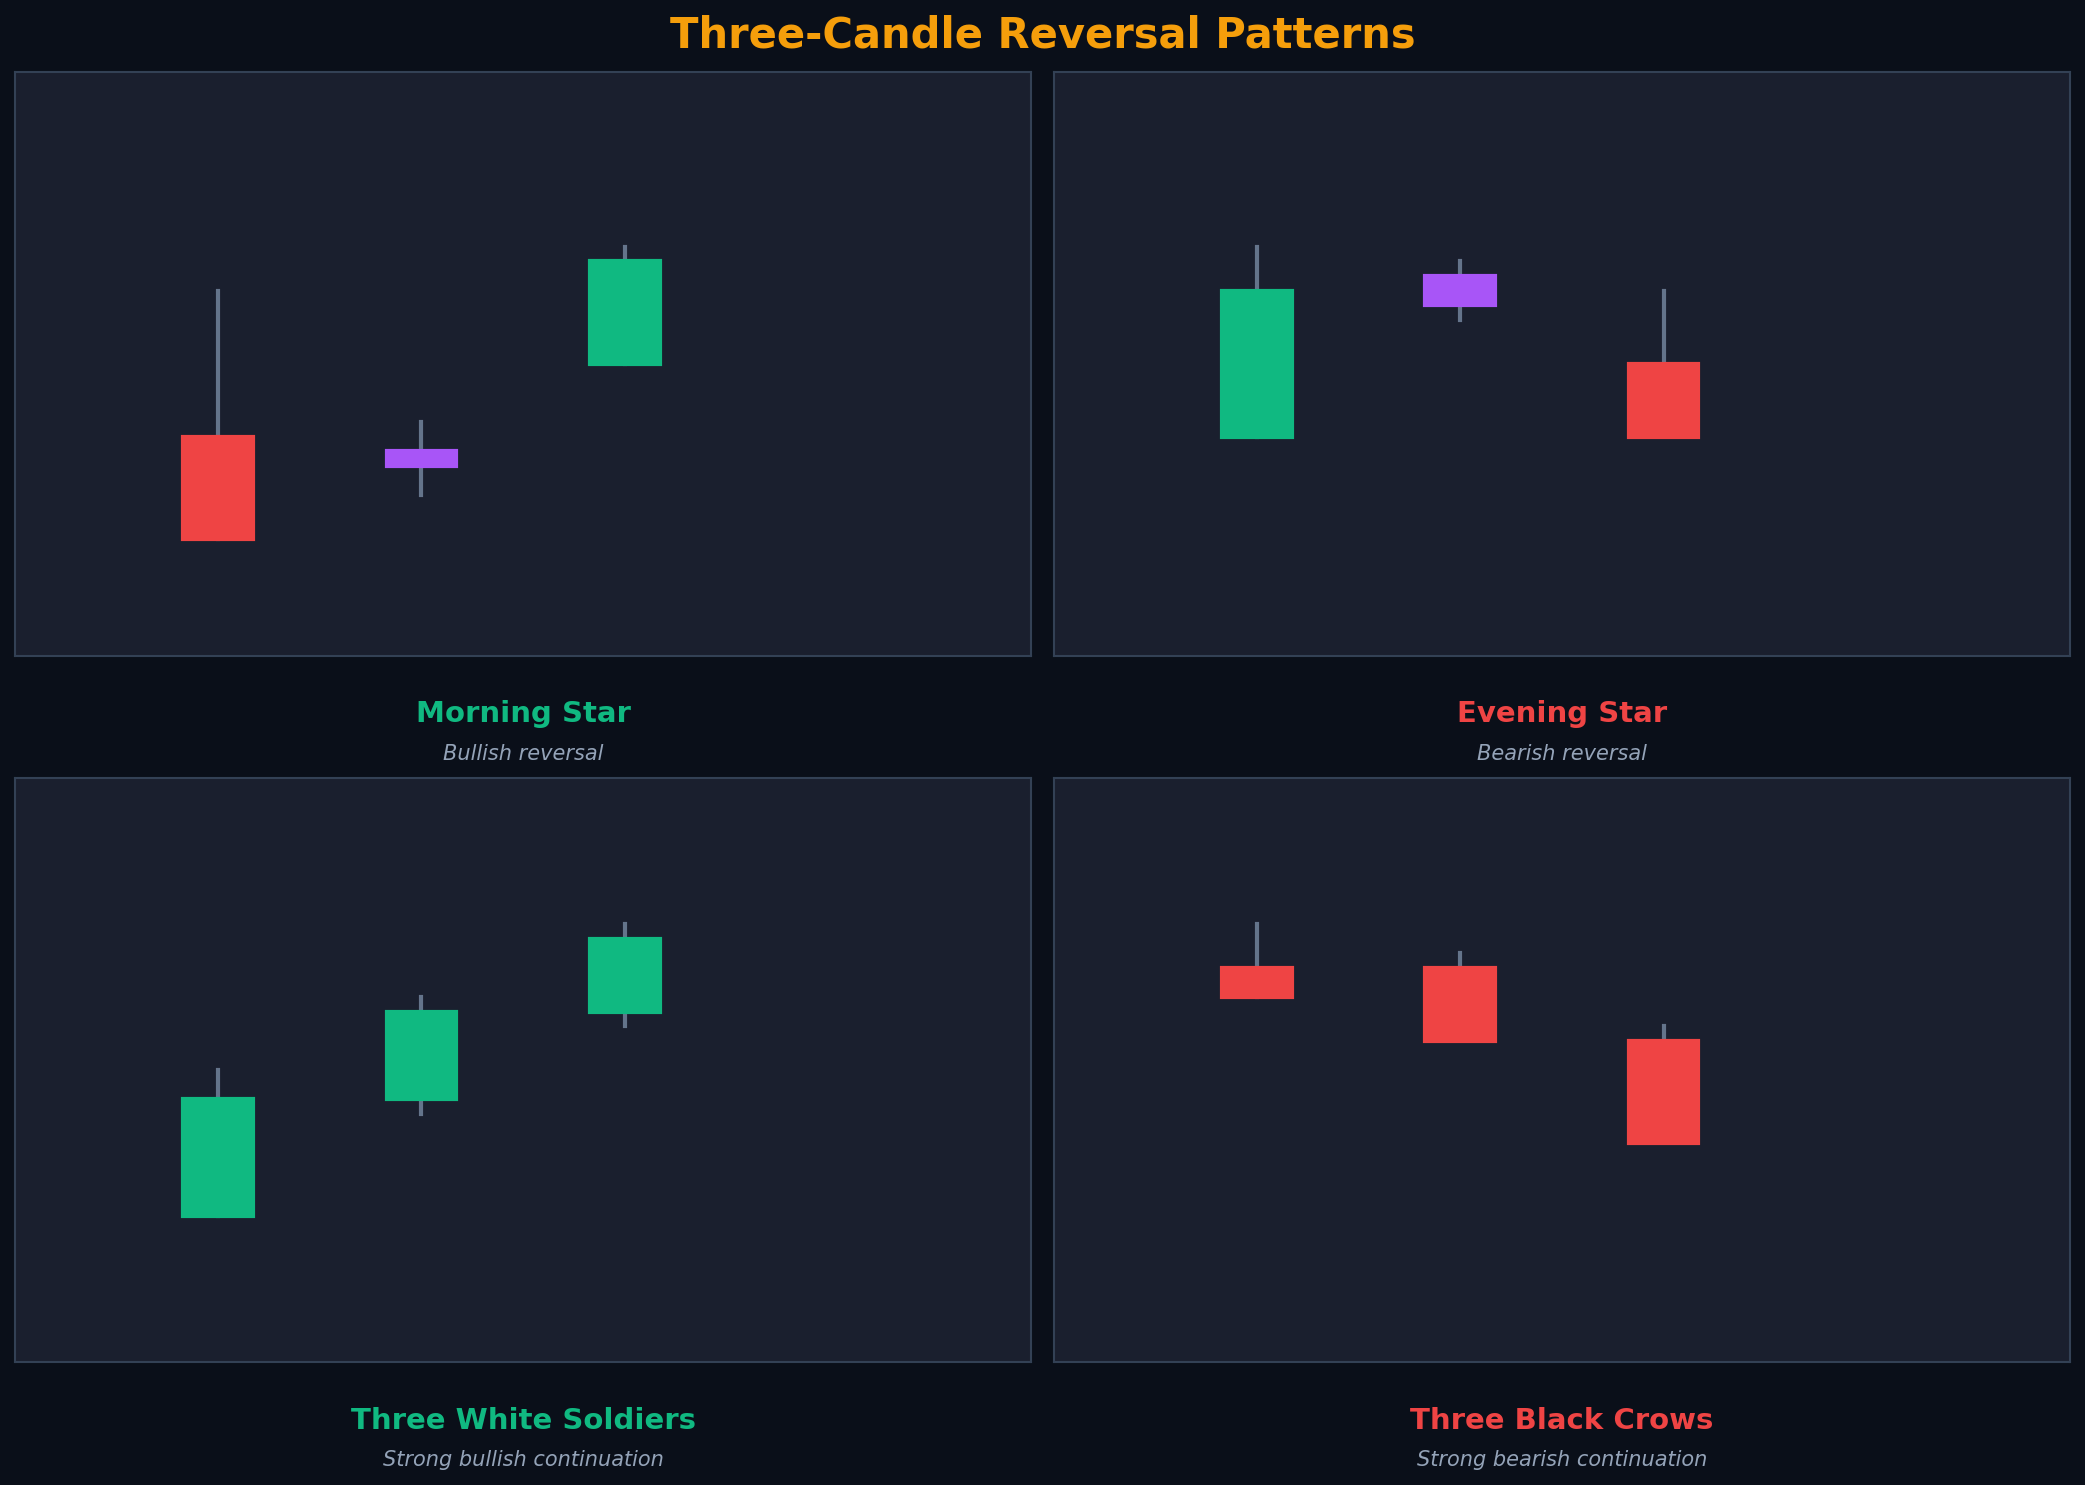
Four most powerful three-candle patterns for major trend reversals
Why Three-Candle Patterns Are Superior
Three-candle patterns are the most reliable reversal signals in technical analysis. While single-candle patterns show indecision and two-candle patterns show momentum shifts, three-candle patterns demonstrate a complete trend reversal process: exhaustion, indecision, and new direction.
These patterns work because they give the market time to confirm the reversal. The first candle shows the old trend weakening, the second candle shows indecision, and the third candle confirms the new trend. This three-step process filters out false signals and provides high-probability setups.
💡 Success Rates
Three-candle patterns at key levels with volume confirmation have 75-85% success rates—significantly higher than single or two-candle patterns.
Morning Star Pattern
Pattern Characteristics
- Appears after a downtrend
- First candle: Large bearish (red) candle continuing downtrend
- Second candle: Small-bodied candle (any color) showing indecision
- Third candle: Large bullish (green) candle confirming reversal
- Second candle ideally gaps down from first candle
- Third candle closes well into first candle's body (above 50%)
Market Psychology
The morning star tells a complete reversal story. Day 1: Sellers dominate with strong bearish candle. Day 2: Market gaps down but neither side can control—indecision forms (often a doji or spinning top). Day 3: Buyers overwhelm sellers, pushing prices sharply higher and closing well into the first candle's body. This three-day battle shows sellers exhausted and buyers taking control.
The name "morning star" comes from the planet Venus, which appears before sunrise—signaling the end of darkness (downtrend) and the coming of light (uptrend).
Trading Rules
Best Context: After extended downtrend at major support level
Entry: Buy at close of third candle or on pullback to third candle's midpoint
Stop Loss: Below the second candle's low (the star)
Target: Recent resistance or 3:1 risk-reward ratio
Volume: Third candle should have highest volume of the three
Strength Factors
- Stronger: Second candle gaps down from first candle
- Stronger: Second candle is a doji (perfect indecision)
- Stronger: Third candle closes above 75% of first candle's body
- Stronger: Pattern appears at tested support level
- Stronger: Volume increases progressively across three candles
- Stronger: RSI was oversold (below 30) on first candle
Example Trade
Setup: Stock in 3-week downtrend hits $48 support (held 4 times). Day 1: Large red candle closes at $48.50. Day 2: Small doji gaps to $47.80, closes at $48. Day 3: Large green candle closes at $51.
Entry: Buy at $51 (close of third candle). Stop at $47.50 (below star low). Target $54.50 (previous resistance).
Result: Risk $3.50, Reward $3.50 (1:1 minimum, often extends to 2:1 or 3:1). Morning star at tested support with doji middle = 80%+ win rate.
Evening Star Pattern
Pattern Characteristics
- Appears after an uptrend
- First candle: Large bullish (green) candle continuing uptrend
- Second candle: Small-bodied candle (any color) showing indecision
- Third candle: Large bearish (red) candle confirming reversal
- Second candle ideally gaps up from first candle
- Third candle closes well into first candle's body (below 50%)
Market Psychology
The evening star is the bearish counterpart to morning star. Day 1: Buyers dominate with strong bullish candle. Day 2: Market gaps up but stalls—neither side controls, forming indecision. Day 3: Sellers overwhelm buyers, pushing prices sharply lower and closing well into the first candle's body. This shows buyers exhausted and sellers taking control.
The name "evening star" refers to Venus appearing after sunset—signaling the end of daylight (uptrend) and the coming of darkness (downtrend).
Trading Rules
Best Context: After extended uptrend at major resistance level
Entry: Sell/short at close of third candle
Stop Loss: Above the second candle's high (the star)
Target: Recent support or 3:1 risk-reward ratio
Volume: Third candle should have highest volume
Three White Soldiers Pattern
Pattern Characteristics
- Appears after a downtrend or consolidation
- Three consecutive large bullish (green) candles
- Each candle opens within previous candle's body
- Each candle closes progressively higher
- Each candle closes near its high (small upper wicks)
- Shows strong, sustained buying pressure
Market Psychology
Three white soldiers show overwhelming bullish momentum. Three consecutive days of strong buying with each day opening within the previous day's body and closing near the high demonstrates relentless buying pressure. Sellers have no control—buyers are "marching" higher like soldiers in formation.
This pattern is particularly powerful after a downtrend or at support levels, signaling a major trend reversal. When it appears after consolidation, it signals a strong breakout.
Trading Rules
Best Context: After downtrend at support or breaking out of consolidation
Entry: Buy at close of third candle or on first pullback
Stop Loss: Below the first soldier's low
Target: Measured move or ride trend with trailing stop
Note: Often leads to extended rallies—consider holding longer
⚠️ Caution: Stalling Pattern
If the third soldier has a long upper wick or small body, it may be "stalling"—showing exhaustion. This weakens the pattern and suggests taking profits rather than entering new positions.
Ideal Characteristics
- Ideal: Each candle is similar size (consistent momentum)
- Ideal: Each candle closes in top 25% of its range
- Ideal: Volume increases across the three candles
- Ideal: Pattern forms at major support level
- Ideal: No long upper wicks (no rejection of higher prices)
Three Black Crows Pattern
Pattern Characteristics
- Appears after an uptrend or consolidation
- Three consecutive large bearish (red) candles
- Each candle opens within previous candle's body
- Each candle closes progressively lower
- Each candle closes near its low (small lower wicks)
- Shows strong, sustained selling pressure
Market Psychology
Three black crows show overwhelming bearish momentum. Three consecutive days of strong selling with each day opening within the previous day's body and closing near the low demonstrates relentless selling pressure. Buyers have no control—sellers are driving prices lower like ominous crows circling.
This pattern is particularly powerful after an uptrend or at resistance levels, signaling a major trend reversal. It's one of the most feared patterns among bulls.
Trading Rules
Best Context: After uptrend at resistance or breaking down from consolidation
Entry: Sell/short at close of third candle
Stop Loss: Above the first crow's high
Target: Measured move or ride trend with trailing stop
Note: Often leads to extended selloffs—consider holding longer
🔴 Warning Sign
Three black crows at all-time highs or major resistance with high volume is an extremely bearish signal. It often marks major tops and the beginning of significant corrections.
Pattern Comparison & Success Rates
| Pattern | Type | Success Rate | Best Context |
|---|---|---|---|
| Morning Star | Bullish reversal | 75-85% | Support after downtrend |
| Evening Star | Bearish reversal | 75-85% | Resistance after uptrend |
| Three White Soldiers | Bullish continuation | 70-80% | Support or breakout |
| Three Black Crows | Bearish continuation | 70-80% | Resistance or breakdown |
💡 Key Insight
Star patterns (morning/evening) are reversal signals. Soldiers/crows patterns are continuation signals showing strong momentum. Both are highly reliable when they appear in the right context.
Advanced Trading Strategies
Strategy 1: Morning Star at Tested Support
Setup: Identify support level tested 3+ times. Wait for morning star with doji middle candle. RSI oversold on first candle.
Entry: Buy at close of third candle if it closes above 75% of first candle's body.
Stop: 1 ATR below star low (second candle).
Target: Previous swing high or 3:1 R:R. This setup has 85%+ win rate.
Strategy 2: Three White Soldiers Breakout
Setup: Stock consolidating for 2+ weeks. Three white soldiers form breaking above consolidation range.
Entry: Buy on first pullback to breakout level (top of consolidation).
Stop: Below consolidation range.
Target: Measured move (height of consolidation added to breakout point). Often extends further—use trailing stops.
Strategy 3: Evening Star with Volume Spike
Setup: Evening star at resistance. Third candle has 2x average volume. RSI overbought (above 70) on first candle.
Entry: Short at close of third candle or on bounce to star high.
Stop: Above star high with 1 ATR buffer.
Edge: Volume spike confirms institutional distribution. Success rate 80%+.
Common Mistakes to Avoid
❌ Trading Star Patterns Without Gaps
While gaps aren't required, they significantly strengthen the pattern. Patterns without gaps have lower success rates.
❌ Ignoring Third Candle Penetration
The third candle in star patterns must close at least 50% into the first candle's body. Less penetration = weak signal.
❌ Trading Stalling Soldiers/Crows
If the third candle has a long opposite wick or small body, the pattern is stalling. This shows exhaustion—don't enter.
❌ Forgetting Trend Context
Star patterns need a trend to reverse. Soldiers/crows need momentum to continue. Don't trade these in sideways markets.
❌ Entering Too Early
Wait for the third candle to close before entering. Don't anticipate—let the pattern complete and confirm.
❌ Ignoring Volume
Volume should increase on the third candle (confirmation candle). Low volume patterns often fail.
Key Takeaways
- Three-candle patterns are the most reliable reversal signals (75-85% success)
- Morning star (bullish) and evening star (bearish) are reversal patterns
- Three white soldiers (bullish) and three black crows (bearish) show momentum
- Star patterns: middle candle shows indecision, third candle confirms reversal
- Soldiers/crows: three consecutive strong candles in same direction
- Gaps strengthen star patterns but aren't required
- Third candle in stars must close 50%+ into first candle's body
- Stalling patterns (long opposite wicks) show exhaustion—avoid
- Volume should increase on confirmation candle (third candle)
- Patterns at support/resistance with volume = highest probability setups
Conclusion
Three-candle patterns represent the pinnacle of candlestick analysis. They provide the highest probability reversal and continuation signals because they demonstrate a complete market process: exhaustion, indecision, and new direction. The morning star and evening star are particularly powerful at major support and resistance levels, often marking significant turning points.
Three white soldiers and three black crows show relentless momentum and often lead to extended moves. When these patterns appear after consolidation or at key levels, they provide excellent risk-reward opportunities with success rates exceeding 70%.
Master these four patterns through extensive practice and observation. Study hundreds of historical examples, measure their performance in different contexts, and develop strict entry rules. When combined with volume analysis, support/resistance levels, and proper risk management, three-candle patterns become your most powerful trading tool.
You've completed the candlestick pattern series!
You now have a complete understanding of candlestick analysis from anatomy to the most powerful three-candle patterns. Review two-candle patterns and single patterns to reinforce your knowledge.
Complete Your Knowledge
Ready to Put This Into Practice?
Join MarketDly to access real-time market insights, AI-powered analysis, and professional trading tools.
No credit card required • Free tier available • Upgrade anytime