Single Candlestick Patterns: Complete Trading Guide
Master the most powerful single-candle reversal patterns: hammer, shooting star, hanging man, inverted hammer, and marubozu
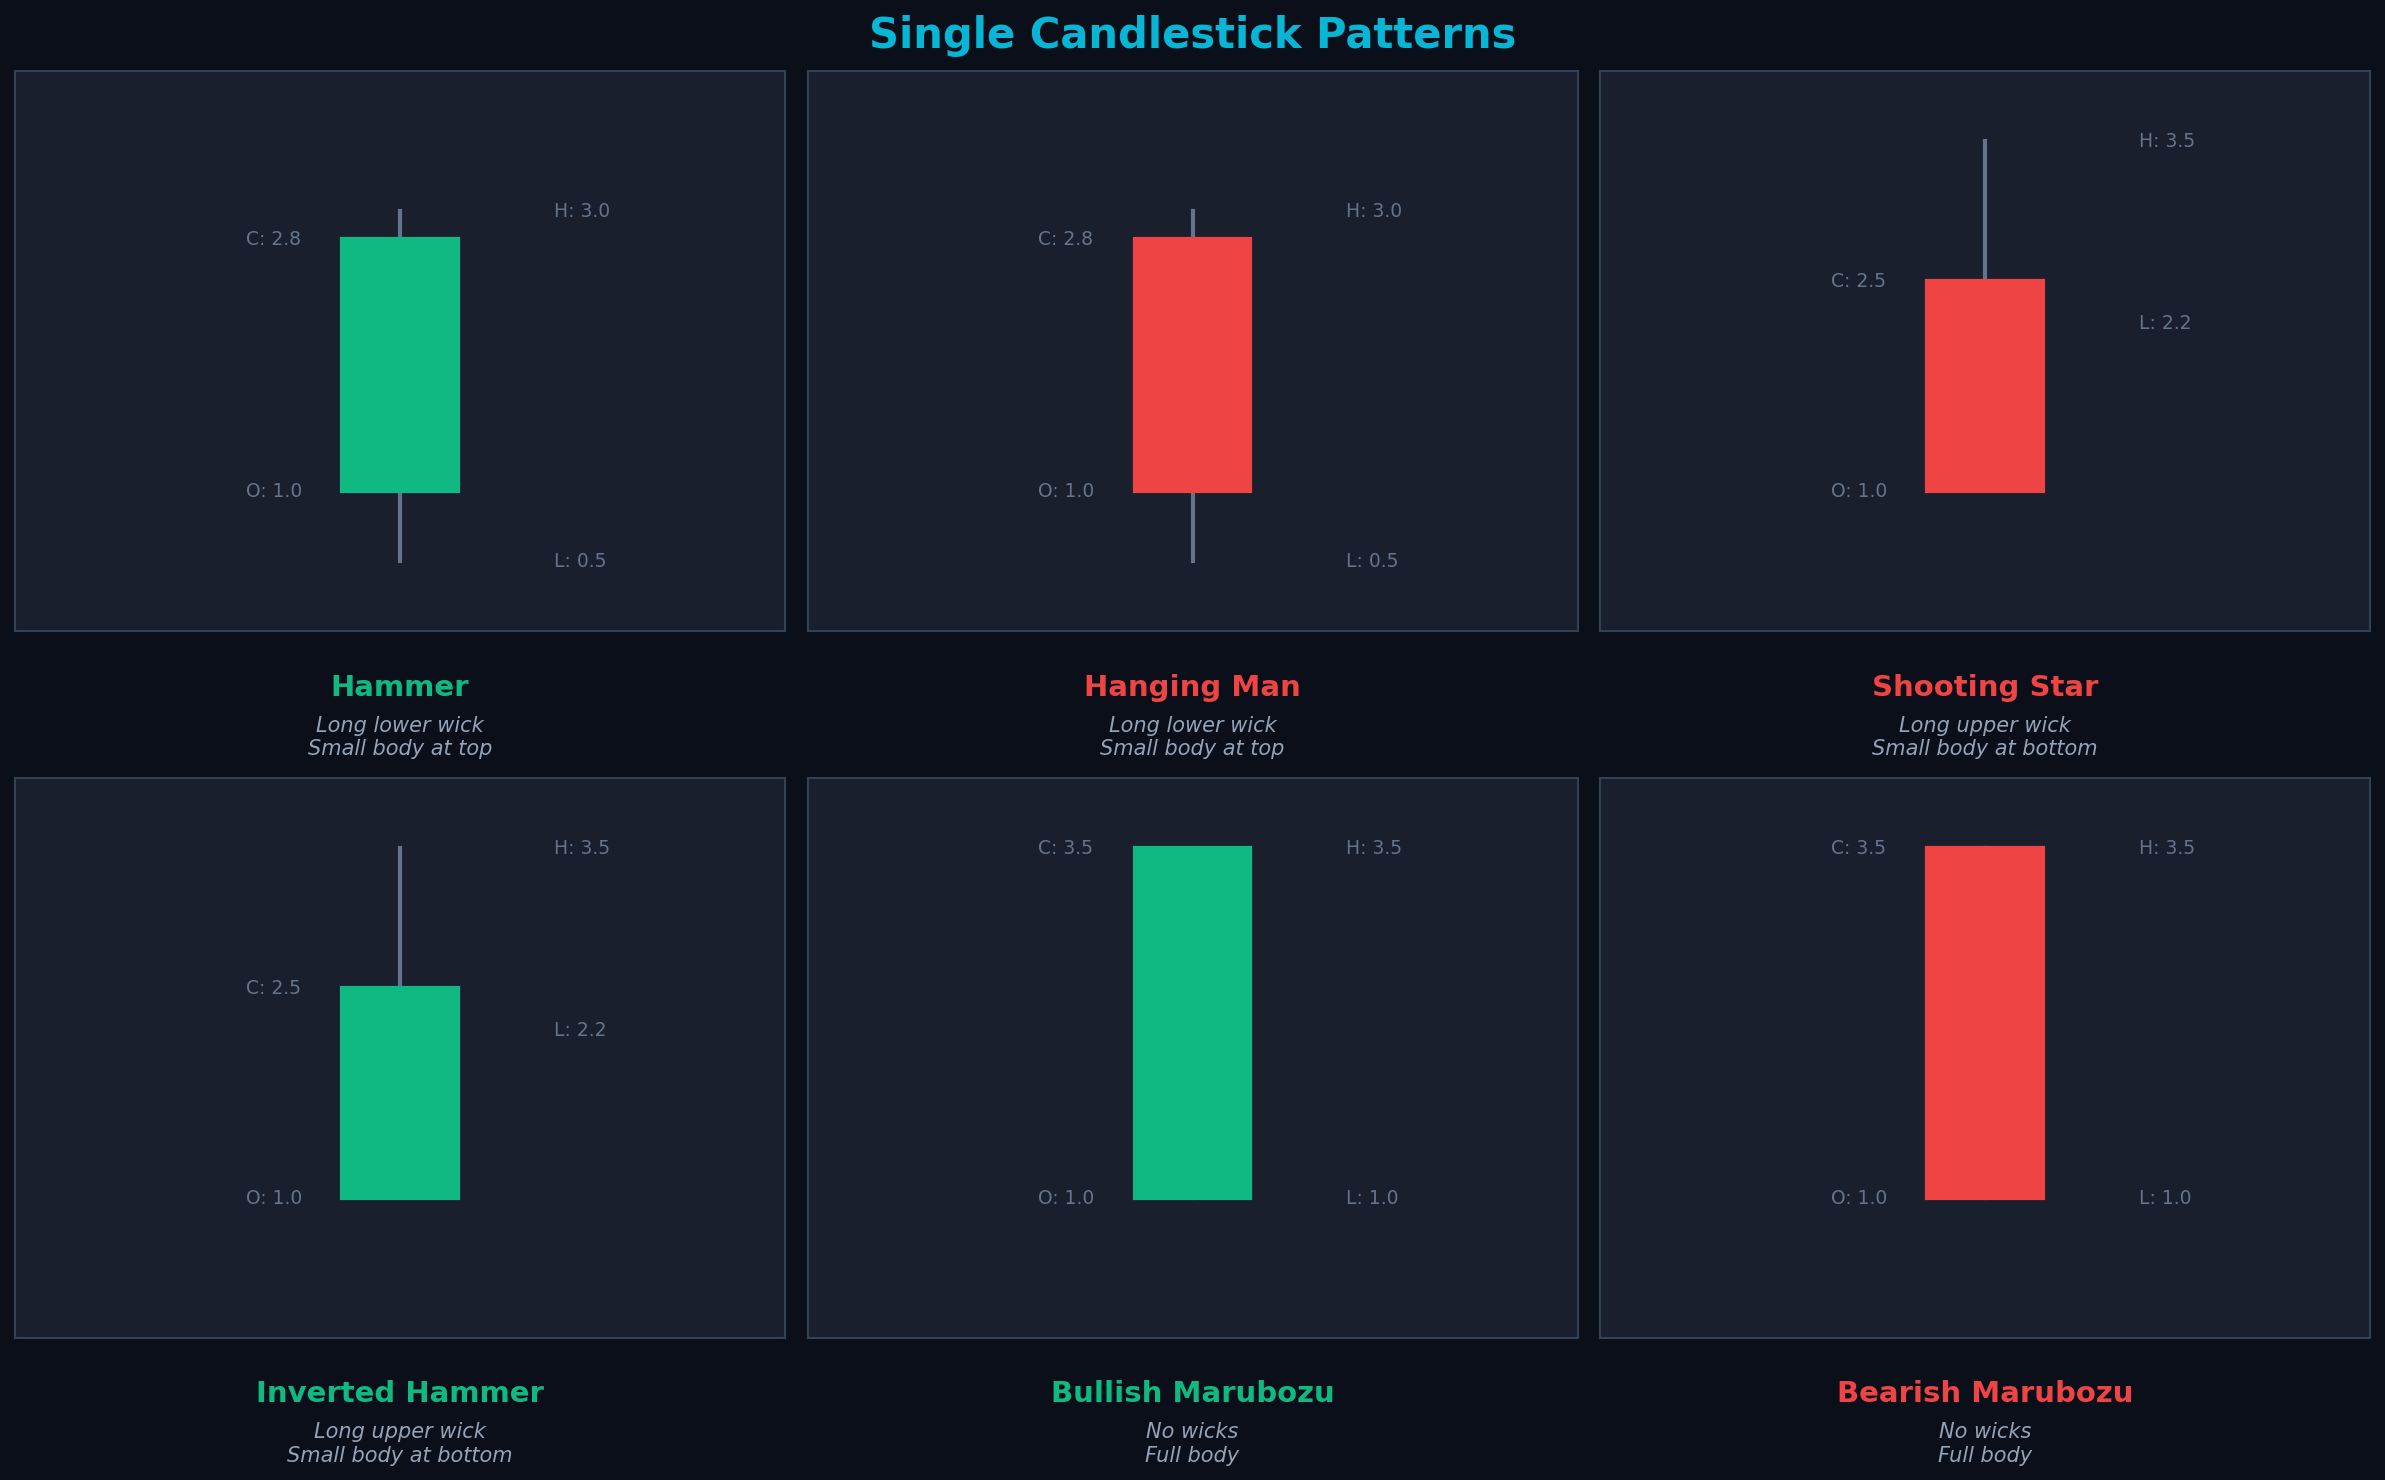
Six essential single candlestick patterns every trader must know
What Are Single Candlestick Patterns?
Single candlestick patterns are formations that provide trading signals based on just one candle. Unlike multi-candle patterns that require confirmation from subsequent candles, these patterns can indicate potential reversals or continuations immediately after formation.
The power of single candlestick patterns lies in their simplicity and immediate actionability. When they appear at key support or resistance levels, they become highly reliable signals for entering or exiting trades.
💡 Key Principle
Single candlestick patterns are most powerful when they appear at significant price levels (support, resistance, trend lines) with high volume confirmation.
The Hammer Pattern
Pattern Characteristics
- Small body at the top of the candle
- Long lower wick (at least 2x body size)
- Little to no upper wick
- Can be green or red (color less important)
- Appears after a downtrend
Market Psychology
The hammer tells a story of rejection. Sellers pushed prices significantly lower during the period, but buyers stepped in aggressively, driving prices back up to close near the high. This shows that selling pressure is exhausted and buyers are taking control.
Trading Rules
Entry: Buy when the next candle closes above the hammer's high
Stop Loss: Place below the hammer's low
Target: Recent resistance or 2:1 risk-reward ratio
Confirmation: High volume on hammer formation
Example Scenario
Setup: Stock in downtrend hits $50 support level. A hammer forms with open at $51, low at $49, close at $50.80.
Action: Enter long at $51.20 (above hammer high). Stop loss at $48.80 (below hammer low). Target $53.80 (2:1 R:R).
Result: The rejection of $49 shows strong support. Buyers defended this level aggressively, signaling a potential reversal.
The Shooting Star Pattern
Pattern Characteristics
- Small body at the bottom of the candle
- Long upper wick (at least 2x body size)
- Little to no lower wick
- Can be green or red (color less important)
- Appears after an uptrend
Market Psychology
The shooting star shows failed bullish momentum. Buyers pushed prices significantly higher during the period, but sellers aggressively rejected those levels, driving prices back down to close near the low. This indicates that buying pressure is exhausted and sellers are taking control.
Trading Rules
Entry: Sell/short when the next candle closes below the shooting star's low
Stop Loss: Place above the shooting star's high
Target: Recent support or 2:1 risk-reward ratio
Confirmation: High volume on shooting star formation
The Hanging Man Pattern
Pattern Characteristics
- Identical structure to hammer (small body, long lower wick)
- Appears after an UPTREND (key difference from hammer)
- Long lower wick (at least 2x body size)
- Little to no upper wick
- Bearish reversal signal
Market Psychology
The hanging man appears at the top of an uptrend and signals potential reversal. Despite buyers recovering from the low, the fact that sellers could push prices down significantly shows emerging selling pressure. It's called "hanging man" because it resembles a person hanging by a rope—a warning sign.
⚠️ Critical Distinction
Hammer = bullish (after downtrend). Hanging Man = bearish (after uptrend). Same shape, opposite meaning based on context!
Trading Rules
Entry: Sell/short when the next candle closes below the hanging man's low
Stop Loss: Place above the hanging man's high
Target: Recent support or 2:1 risk-reward ratio
Confirmation: Requires strong confirmation—wait for bearish follow-through
The Inverted Hammer Pattern
Pattern Characteristics
- Small body at the bottom of the candle
- Long upper wick (at least 2x body size)
- Little to no lower wick
- Appears after a DOWNTREND
- Bullish reversal signal
Market Psychology
The inverted hammer shows buyers attempting to push prices higher, but sellers initially rejecting those levels. However, the fact that buyers tried to rally is significant—it shows emerging buying interest after a downtrend. The next candle's confirmation is crucial.
Trading Rules
Entry: Buy when the next candle closes above the inverted hammer's high
Stop Loss: Place below the inverted hammer's low
Target: Recent resistance or 2:1 risk-reward ratio
Confirmation: Requires bullish follow-through candle
The Marubozu Patterns
Marubozu means "bald" or "shaved head" in Japanese, referring to candles with no wicks. These are the strongest continuation signals, showing complete dominance by either buyers or sellers.
Bullish Marubozu
Pattern Characteristics
- Long green body with no wicks
- Opens at the low, closes at the high
- Shows complete buyer dominance
- Strong continuation signal in uptrends
- Powerful reversal signal at support
Market Psychology
Buyers controlled the entire period from open to close. No sellers could push prices down even momentarily. This shows extreme bullish conviction and often leads to continued upward movement.
Bearish Marubozu
Pattern Characteristics
- Long red body with no wicks
- Opens at the high, closes at the low
- Shows complete seller dominance
- Strong continuation signal in downtrends
- Powerful reversal signal at resistance
Market Psychology
Sellers controlled the entire period from open to close. No buyers could push prices up even momentarily. This shows extreme bearish conviction and often leads to continued downward movement.
Trading Marubozu Patterns
Bullish Entry: Buy at the close or on a small pullback
Bullish Stop: Below the marubozu's low
Bearish Entry: Sell/short at the close or on a small bounce
Bearish Stop: Above the marubozu's high
Note: Marubozu patterns rarely need confirmation—they are self-confirming
Pattern Comparison & Selection
| Pattern | Context | Signal | Strength |
|---|---|---|---|
| Hammer | After downtrend | Bullish reversal | Strong |
| Shooting Star | After uptrend | Bearish reversal | Strong |
| Hanging Man | After uptrend | Bearish reversal | Moderate |
| Inverted Hammer | After downtrend | Bullish reversal | Moderate |
| Bullish Marubozu | Any trend | Bullish continuation | Very Strong |
| Bearish Marubozu | Any trend | Bearish continuation | Very Strong |
Common Mistakes to Avoid
❌ Ignoring Context
A hammer in the middle of an uptrend is not a reversal signal. Always check if the pattern appears after the correct trend direction.
❌ Trading Without Confirmation
Except for marubozu, most single candle patterns need confirmation from the next candle. Don't jump in immediately.
❌ Neglecting Support/Resistance
These patterns are 10x more powerful at key price levels. A hammer at major support is far more reliable than one in no-man's land.
❌ Ignoring Volume
High volume confirms conviction. A hammer with low volume lacks the buying pressure needed for a true reversal.
❌ Wrong Wick-to-Body Ratio
The wick should be at least 2x the body size. A short wick doesn't show strong rejection and weakens the pattern.
Advanced Trading Strategies
Strategy 1: Support/Resistance Confluence
Setup: Wait for a hammer or inverted hammer to form at a major support level that has been tested multiple times.
Entry: Enter when the next candle closes above the pattern's high with increased volume.
Stop: Tight stop below the support level (below pattern low).
Target: Next resistance level or 3:1 risk-reward ratio.
Strategy 2: Trend Continuation with Marubozu
Setup: Identify a strong trend (price above/below 20 EMA). Wait for a pullback to the moving average.
Entry: Enter when a marubozu forms in the trend direction at the moving average.
Stop: Beyond the marubozu and moving average.
Target: Ride the trend with trailing stops.
Strategy 3: Multiple Time Frame Confirmation
Setup: Identify a hammer on the daily chart at support.
Confirmation: Check the 4-hour chart for bullish momentum (higher lows forming).
Entry: Use the 1-hour chart to time your entry when price breaks above the hammer high.
Result: Higher probability trade with multiple time frame alignment.
Key Takeaways
- Hammer and inverted hammer are bullish reversal patterns after downtrends
- Shooting star and hanging man are bearish reversal patterns after uptrends
- Marubozu patterns show extreme conviction and rarely need confirmation
- Context is everything—same shape, different meaning based on trend direction
- Wick should be at least 2x body size for hammer/shooting star patterns
- Patterns at support/resistance levels are significantly more reliable
- Volume confirmation increases pattern reliability by 50%+
- Wait for confirmation candle before entering (except marubozu)
- Always use stop losses—place beyond the pattern's high/low
- Practice identifying these patterns on historical charts before trading live
Conclusion
Single candlestick patterns are powerful tools for identifying potential reversals and continuations. The hammer, shooting star, hanging man, inverted hammer, and marubozu patterns each tell a unique story about market psychology and the battle between buyers and sellers.
The key to success with these patterns is understanding context. A hammer after a downtrend at support is a high-probability bullish signal. The same pattern in the middle of an uptrend means nothing. Always consider the trend, support/resistance levels, volume, and wait for confirmation before trading.
Master these five patterns through practice and observation. Study hundreds of historical examples, note what worked and what didn't, and gradually develop an intuition for high-probability setups. Combined with proper risk management, these patterns can become a cornerstone of your trading strategy.
Ready for the next level?
Continue your journey by exploring doji patterns, where you'll learn to read market indecision and identify powerful reversal signals. Also review candlestick anatomy to strengthen your foundation.
Continue Learning
Ready to Put This Into Practice?
Join MarketDly to access real-time market insights, AI-powered analysis, and professional trading tools.
No credit card required • Free tier available • Upgrade anytime