Doji Candlestick Patterns: Complete Trading Guide
Master the art of reading market indecision with standard, dragonfly, gravestone, and long-legged doji patterns
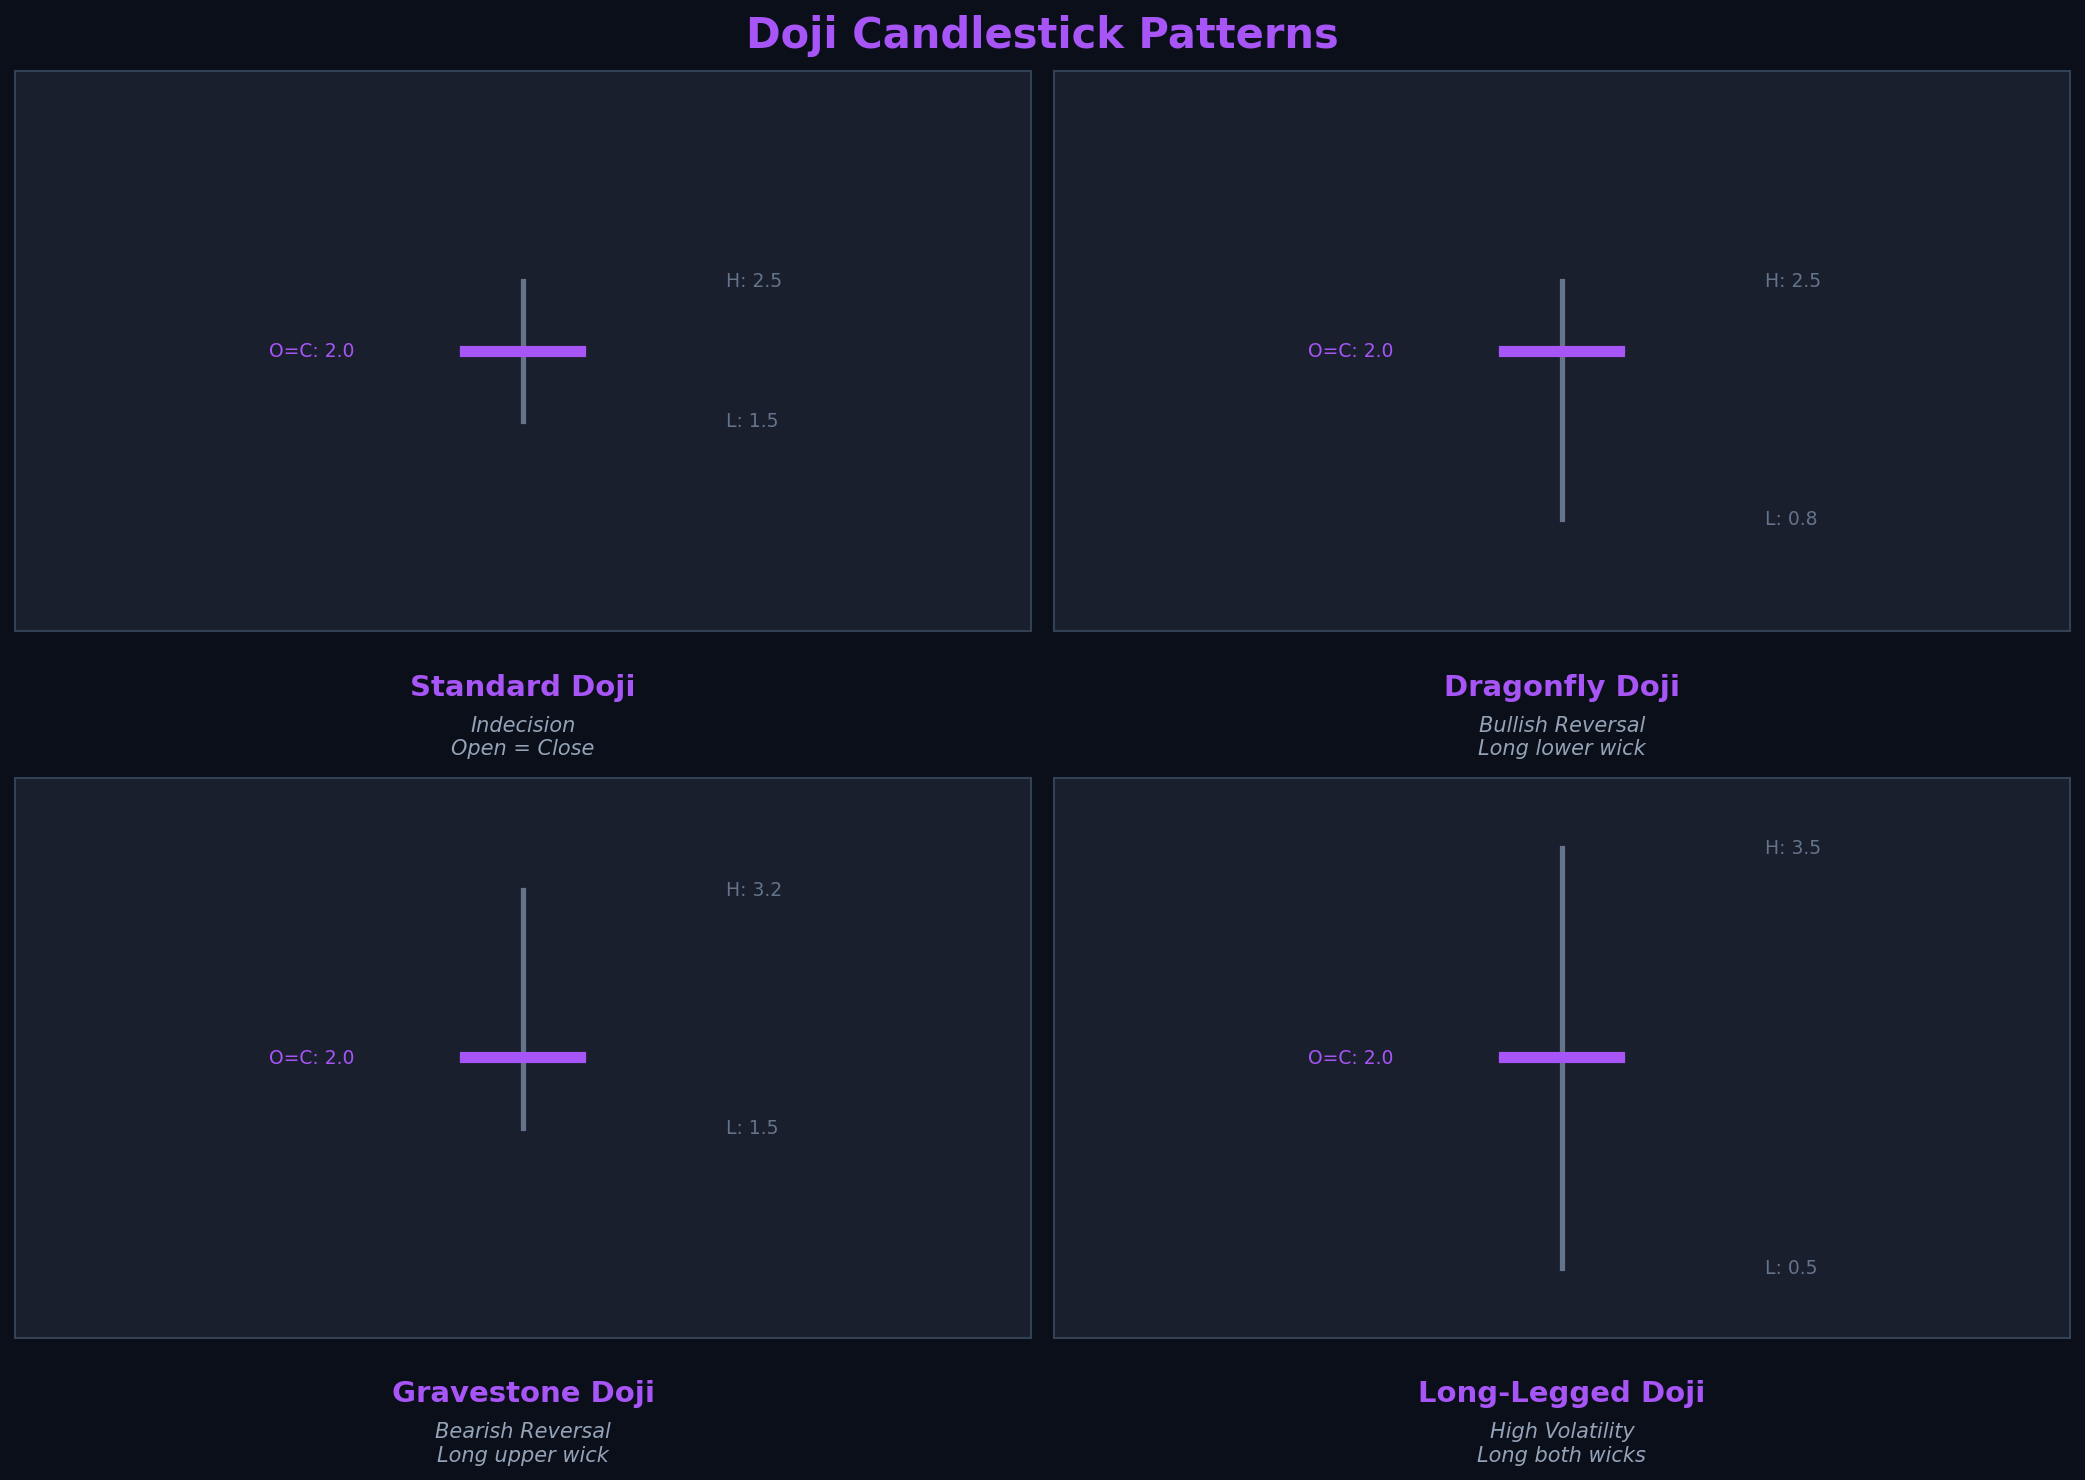
Four essential doji patterns for identifying market turning points
What is a Doji?
A doji is a candlestick pattern where the opening and closing prices are virtually identical, creating a candle with little to no body. The name comes from the Japanese word meaning "the same thing" or "mistake," referring to the rare occurrence of open and close being equal.
Doji patterns represent perfect equilibrium between buyers and sellers. Neither side could gain control during the period, resulting in the price closing exactly where it opened. This indecision often signals that the current trend is losing momentum and a reversal may be imminent.
💡 Core Concept
A doji doesn't predict direction—it signals indecision. The next candle's direction typically determines whether bulls or bears will win the battle.
Doji Formation Rules
- Open and close must be equal or within 0.1% of each other
- Body should be extremely small or non-existent
- Wicks can vary in length (defines doji type)
- Color doesn't matter (often shown as neutral)
- Most powerful at trend extremes
Standard Doji
Pattern Characteristics
- No body (open = close)
- Upper and lower wicks of similar length
- Resembles a plus sign (+) or cross
- Shows perfect balance between buyers and sellers
- Neutral signal requiring confirmation
Market Psychology
The standard doji shows complete uncertainty. Prices moved both up and down during the period, but neither buyers nor sellers could establish control. The market tested both directions and rejected both, closing exactly where it opened.
Trading Rules
Context: Most significant after strong trends
Entry: Wait for next candle to confirm direction
Bullish Confirmation: Next candle closes above doji high
Bearish Confirmation: Next candle closes below doji low
Stop Loss: Beyond the doji's opposite wick
⚠️ Important
A doji in a sideways market means nothing. Only trade dojis that appear after strong directional moves or at key support/resistance levels.
Dragonfly Doji
Pattern Characteristics
- No body (open = close)
- Long lower wick
- No upper wick (or very small)
- Resembles a "T" shape
- Bullish reversal signal
Market Psychology
The dragonfly doji tells a powerful story. Sellers pushed prices significantly lower during the period, but buyers stepped in with such force that they drove prices all the way back to the opening level. This complete rejection of lower prices shows strong buying pressure and potential trend reversal.
The name "dragonfly" comes from its resemblance to a dragonfly with wings spread downward. It's one of the most bullish single-candle patterns when it appears after a downtrend at support.
Trading Rules
Best Context: After downtrend at support level
Entry: Buy when next candle closes above dragonfly high
Stop Loss: Below the dragonfly's low (the wick bottom)
Target: Recent resistance or 2:1 risk-reward
Volume: High volume strengthens the signal significantly
Example Scenario
Setup: Stock in downtrend hits $45 support (tested 3 times before). Dragonfly doji forms: open/close at $46, low at $44.
Signal: Sellers tried to break support at $44 but failed. Buyers defended aggressively, pushing back to $46.
Action: Enter long at $46.50 (above doji). Stop at $43.80 (below low). Target $49.50 (previous resistance). Risk: $2.70, Reward: $3.00 (1.1:1 R:R).
Gravestone Doji
Pattern Characteristics
- No body (open = close)
- Long upper wick
- No lower wick (or very small)
- Resembles an inverted "T" or tombstone
- Bearish reversal signal
Market Psychology
The gravestone doji is the bearish counterpart to the dragonfly. Buyers pushed prices significantly higher during the period, but sellers stepped in with overwhelming force, driving prices all the way back down to the opening level. This complete rejection of higher prices shows strong selling pressure.
The ominous name "gravestone" reflects its appearance (like a tombstone) and its bearish implications. When it appears after an uptrend at resistance, it's one of the most reliable bearish reversal signals.
Trading Rules
Best Context: After uptrend at resistance level
Entry: Sell/short when next candle closes below gravestone low
Stop Loss: Above the gravestone's high (the wick top)
Target: Recent support or 2:1 risk-reward
Volume: High volume confirms strong rejection
🔴 Warning Sign
A gravestone doji at all-time highs or major resistance is an extremely bearish signal. It shows buyers exhausted their momentum and sellers are taking control.
Long-Legged Doji
Pattern Characteristics
- No body (open = close)
- Very long upper wick
- Very long lower wick
- Resembles a plus sign (+) with extended lines
- Shows extreme volatility and indecision
Market Psychology
The long-legged doji (also called "rickshaw man" or "high wave") shows extreme volatility and uncertainty. Prices swung wildly in both directions during the period, with both buyers and sellers making aggressive attempts to control the market, but neither side winning.
This pattern indicates maximum confusion and often appears at major turning points. The long wicks show that both higher and lower prices were tested and rejected, leaving the market at a crossroads.
Trading Rules
Best Context: After extended trends or at major support/resistance
Entry: Wait for strong confirmation candle in either direction
Bullish Confirmation: Next candle closes above the upper wick
Bearish Confirmation: Next candle closes below the lower wick
Stop Loss: Beyond the opposite wick (wider stops needed)
⚠️ Caution
Long-legged doji requires the strongest confirmation. The extreme volatility means false breakouts are common. Wait for a decisive move before entering.
Doji Pattern Comparison
| Pattern | Wicks | Signal | Reliability |
|---|---|---|---|
| Standard Doji | Equal length | Neutral/Reversal | Moderate |
| Dragonfly Doji | Long lower only | Bullish reversal | High |
| Gravestone Doji | Long upper only | Bearish reversal | High |
| Long-Legged Doji | Both very long | High volatility | Moderate |
Advanced Trading Strategies
Strategy 1: Doji at Key Levels
Setup: Identify major support/resistance that has been tested multiple times. Wait for a doji to form at this level.
Entry: Enter when the next candle confirms direction with a close beyond the doji's range.
Stop: Tight stop beyond the doji's opposite wick.
Edge: Combining doji indecision with key levels creates high-probability setups with excellent risk-reward ratios.
Strategy 2: Doji Star Patterns
Morning Doji Star: Downtrend → Large bearish candle → Doji gaps down → Large bullish candle. Powerful bullish reversal.
Evening Doji Star: Uptrend → Large bullish candle → Doji gaps up → Large bearish candle. Powerful bearish reversal.
Note: These three-candle patterns are among the most reliable reversal signals in technical analysis.
Strategy 3: Multiple Time Frame Doji
Setup: Identify a doji on the daily chart at a key level.
Confirmation: Check if the 4-hour chart also shows indecision or reversal patterns.
Entry: Use the 1-hour chart to time your entry when price breaks the doji's range.
Result: Multiple time frame alignment significantly increases win rate.
Common Mistakes to Avoid
❌ Trading Doji in Sideways Markets
Doji patterns in consolidation zones are meaningless. Only trade dojis after strong trends or at key levels.
❌ Entering Without Confirmation
A doji alone is not a signal—it's a warning. Always wait for the next candle to confirm direction before entering.
❌ Ignoring the Body Size
If the body is more than 5-10% of the total range, it's not a true doji. The open and close must be nearly identical.
❌ Forgetting Volume Analysis
High volume on a doji shows genuine indecision. Low volume dojis lack conviction and are less reliable.
❌ Using Tight Stops on Long-Legged Doji
The extreme volatility shown by long-legged doji requires wider stops. Tight stops will get hit by normal price action.
Key Takeaways
- Doji patterns show indecision where open equals close
- Dragonfly doji (long lower wick) is bullish after downtrends
- Gravestone doji (long upper wick) is bearish after uptrends
- Long-legged doji shows extreme volatility and requires strong confirmation
- Doji patterns are most powerful at key support/resistance levels
- Always wait for confirmation from the next candle before trading
- High volume on doji formation increases reliability significantly
- Doji in sideways markets are meaningless—only trade after trends
- Morning/Evening Doji Star patterns are powerful three-candle reversals
- Multiple time frame doji alignment creates highest probability setups
Conclusion
Doji patterns are among the most important candlestick formations for identifying market turning points. They signal that the current trend is losing momentum and a reversal may be imminent. However, doji patterns don't predict direction—they simply warn of indecision.
The key to trading doji patterns successfully is context and confirmation. A dragonfly doji at major support after a downtrend is a high-probability bullish signal. A gravestone doji at resistance after an uptrend is a high-probability bearish signal. But both require confirmation from the next candle before entering trades.
Master these four doji variations through practice and observation. Study hundreds of historical examples, note which contexts produced the best results, and develop rules for your trading. Combined with volume analysis and support/resistance levels, doji patterns become powerful tools for timing market entries and exits.
Ready to advance?
Continue your journey by exploring two-candle patterns like engulfing and piercing line for even more powerful reversal signals. Review single candlestick patterns to master the basics first.
Continue Learning
Ready to Put This Into Practice?
Join MarketDly to access real-time market insights, AI-powered analysis, and professional trading tools.
No credit card required • Free tier available • Upgrade anytime