Double Top & Double Bottom Patterns: Complete Trading Guide
Master the M and W patterns for simple yet powerful reversal signals with 70-80% success rates
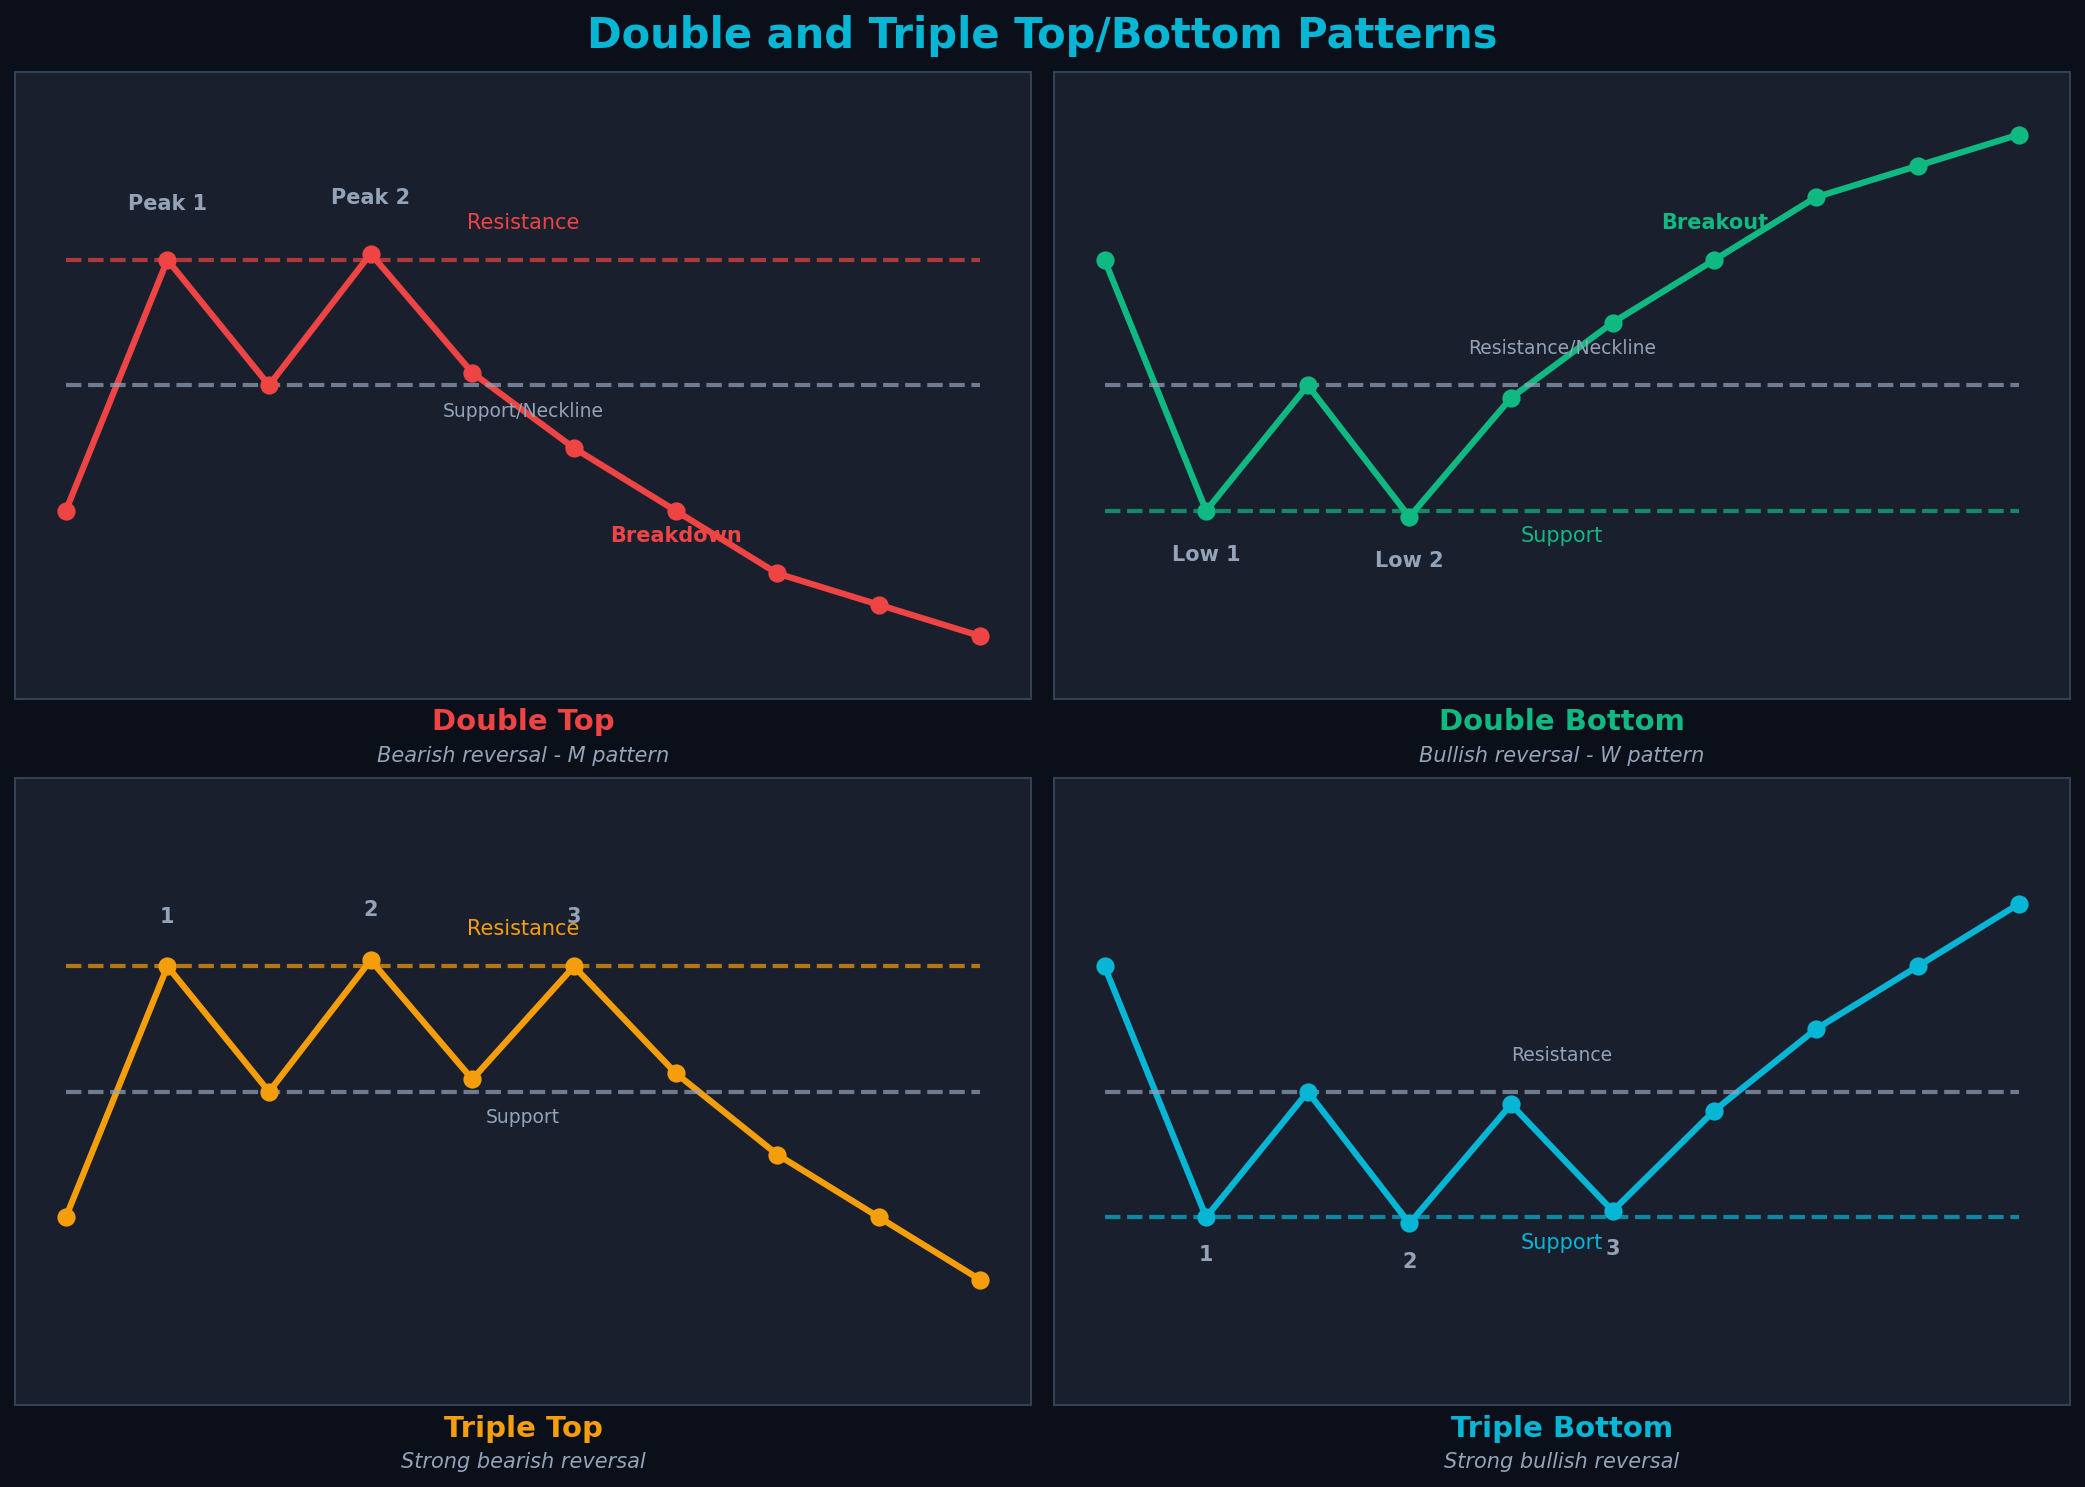
Double and triple top/bottom reversal patterns
Understanding Double Tops and Bottoms
Double top and double bottom patterns are simpler versions of the head and shoulders pattern. They're easier to identify, form more frequently, and provide reliable reversal signals. The double top forms an "M" shape (bearish), while the double bottom forms a "W" shape (bullish).
These patterns work because they show price testing a key level twice and failing. The first test shows initial resistance/support. The second test confirms that level is strong. When the neckline breaks, it signals the reversal is confirmed and traders who bought/sold at those levels are now trapped.
💡 Success Rate
Double top and bottom patterns have 70-80% success rates when they form at major support/resistance levels with proper volume confirmation.
Double Top Pattern (Bearish)
Pattern Structure
- Peak 1: Price rallies to resistance and pulls back
- Trough: Price declines to support (forms the neckline)
- Peak 2: Price rallies back to same resistance level and fails
- Neckline: Support level connecting the trough
- Breakdown: Price breaks below neckline, confirming pattern
Recognition Rules
- Prior Uptrend: Must form after sustained uptrend (minimum 1-2 months)
- Two Peaks: Should be at approximately same price level (within 3-5%)
- Time Between Peaks: Minimum 2 weeks, maximum 6 months (typically 1-3 months)
- Trough Depth: Should be at least 10-15% below peaks
- Volume: Second peak should have lower volume than first
- Neckline Break: Must close below neckline on increased volume
Market Psychology
Peak 1: Bulls push to new highs but meet strong resistance. Profit-taking causes pullback. This creates the first peak and establishes resistance.
Trough: Price declines as early sellers take profits. Buyers see this as opportunity and step in at support, creating the trough.
Peak 2: Bulls attempt another rally but fail at the same resistance. Lower volume shows weakening conviction. Sellers remember the first rejection and sell aggressively.
Breakdown: When price breaks the neckline, it confirms resistance is too strong. Buyers who bought at the trough are now trapped. Their stop losses accelerate the decline.
Trading Strategy
Entry: Sell/short when price closes below neckline
Stop Loss: Above peak 2 (or above peak 1 if higher)
Target: Measure peak to neckline distance, project down from breakdown
Volume: Must increase on breakdown for confirmation
Pullback Trade: 50% of patterns pull back to neckline—add position
Price Target Calculation
Step 1: Measure vertical distance from peaks to neckline
Step 2: Subtract this distance from neckline breakdown point
Example: Peaks at $100, neckline at $85 = $15 distance. Target = $85 - $15 = $70
Note: This is minimum target. 60% of patterns reach target, 30% exceed it.
Double Bottom Pattern (Bullish)
Pattern Structure
- Low 1: Price declines to support and bounces
- Peak: Price rallies to resistance (forms the neckline)
- Low 2: Price declines back to same support level and bounces
- Neckline: Resistance level connecting the peak
- Breakout: Price breaks above neckline, confirming pattern
Recognition Rules
- Prior Downtrend: Must form after sustained downtrend
- Two Lows: Should be at approximately same price level (within 3-5%)
- Time Between Lows: Minimum 2 weeks, maximum 6 months
- Peak Height: Should be at least 10-15% above lows
- Volume: Second low should have lower volume than first
- Breakout Volume: Must increase significantly on neckline break
Market Psychology
The double bottom shows the opposite psychology. Bears exhaust themselves at support. The second test with lower volume shows sellers losing conviction. The neckline breakout confirms buyers have taken control.
Trading Strategy
Entry: Buy when price closes above neckline
Stop Loss: Below low 2 (or below low 1 if lower)
Target: Measure neckline to lows distance, project up from breakout
Volume: Must increase on breakout
Pullback Trade: Can pull back to neckline—opportunity to add
Key Differences from Head and Shoulders
| Feature | Double Top/Bottom | Head & Shoulders |
|---|---|---|
| Peaks/Troughs | 2 equal peaks/troughs | 3 peaks (middle highest) |
| Formation Time | 1-3 months typical | 2-6 months typical |
| Success Rate | 70-80% | 75-85% |
| Frequency | More common | Less common |
| Complexity | Simpler to identify | More complex |
Common Mistakes to Avoid
❌ Peaks/Lows Not Equal
If peaks differ by more than 5%, it's not a double top. Same for double bottoms. Precision matters.
❌ Insufficient Time Between Peaks
Peaks less than 2 weeks apart are just consolidation, not a reversal pattern. Need minimum 2 weeks, ideally 1-3 months.
❌ Shallow Trough/Peak
Trough should be at least 10-15% below peaks. Shallow patterns lack conviction and often fail.
❌ Ignoring Volume
Second peak/low should have lower volume. Breakout/breakdown must have high volume. Without this, pattern is weak.
❌ Trading Before Neckline Break
30% of patterns fail before completing. Always wait for neckline break confirmation.
Key Takeaways
- Double top/bottom patterns have 70-80% success rates
- Simpler and more frequent than head and shoulders
- Peaks/lows must be within 3-5% of each other
- Minimum 2 weeks between peaks/lows, typically 1-3 months
- Volume should decline on second peak/low
- Neckline break must have increased volume
- Target: measure peak-to-neckline distance, project from break
- 50% of patterns pull back to neckline after break
- Triple tops/bottoms are stronger but rarer variations
- Always use stops: above peaks (bearish) or below lows (bullish)
Conclusion
Double top and double bottom patterns are essential tools for every trader. Their simplicity, frequency, and reliability make them ideal for identifying major reversals. While slightly less reliable than head and shoulders patterns, they form much more often and are easier to spot in real-time.
The key to success is patience and discipline. Wait for both peaks/lows to form, confirm with volume, and only enter after the neckline breaks. Use proper stop losses and take profits at the measured target. When combined with support/resistance analysis and other technical tools, double tops and bottoms provide consistent, high-probability trading opportunities.
Continue your chart pattern education
Next, explore triangle patterns for powerful continuation signals. Also review head and shoulders for more complex reversal patterns.
Related Patterns
Ready to Put This Into Practice?
Join MarketDly to access real-time market insights, AI-powered analysis, and professional trading tools.
No credit card required • Free tier available • Upgrade anytime