Head and Shoulders Pattern: Complete Trading Guide
Master the most reliable reversal pattern in technical analysis with 75%+ success rates at major turning points
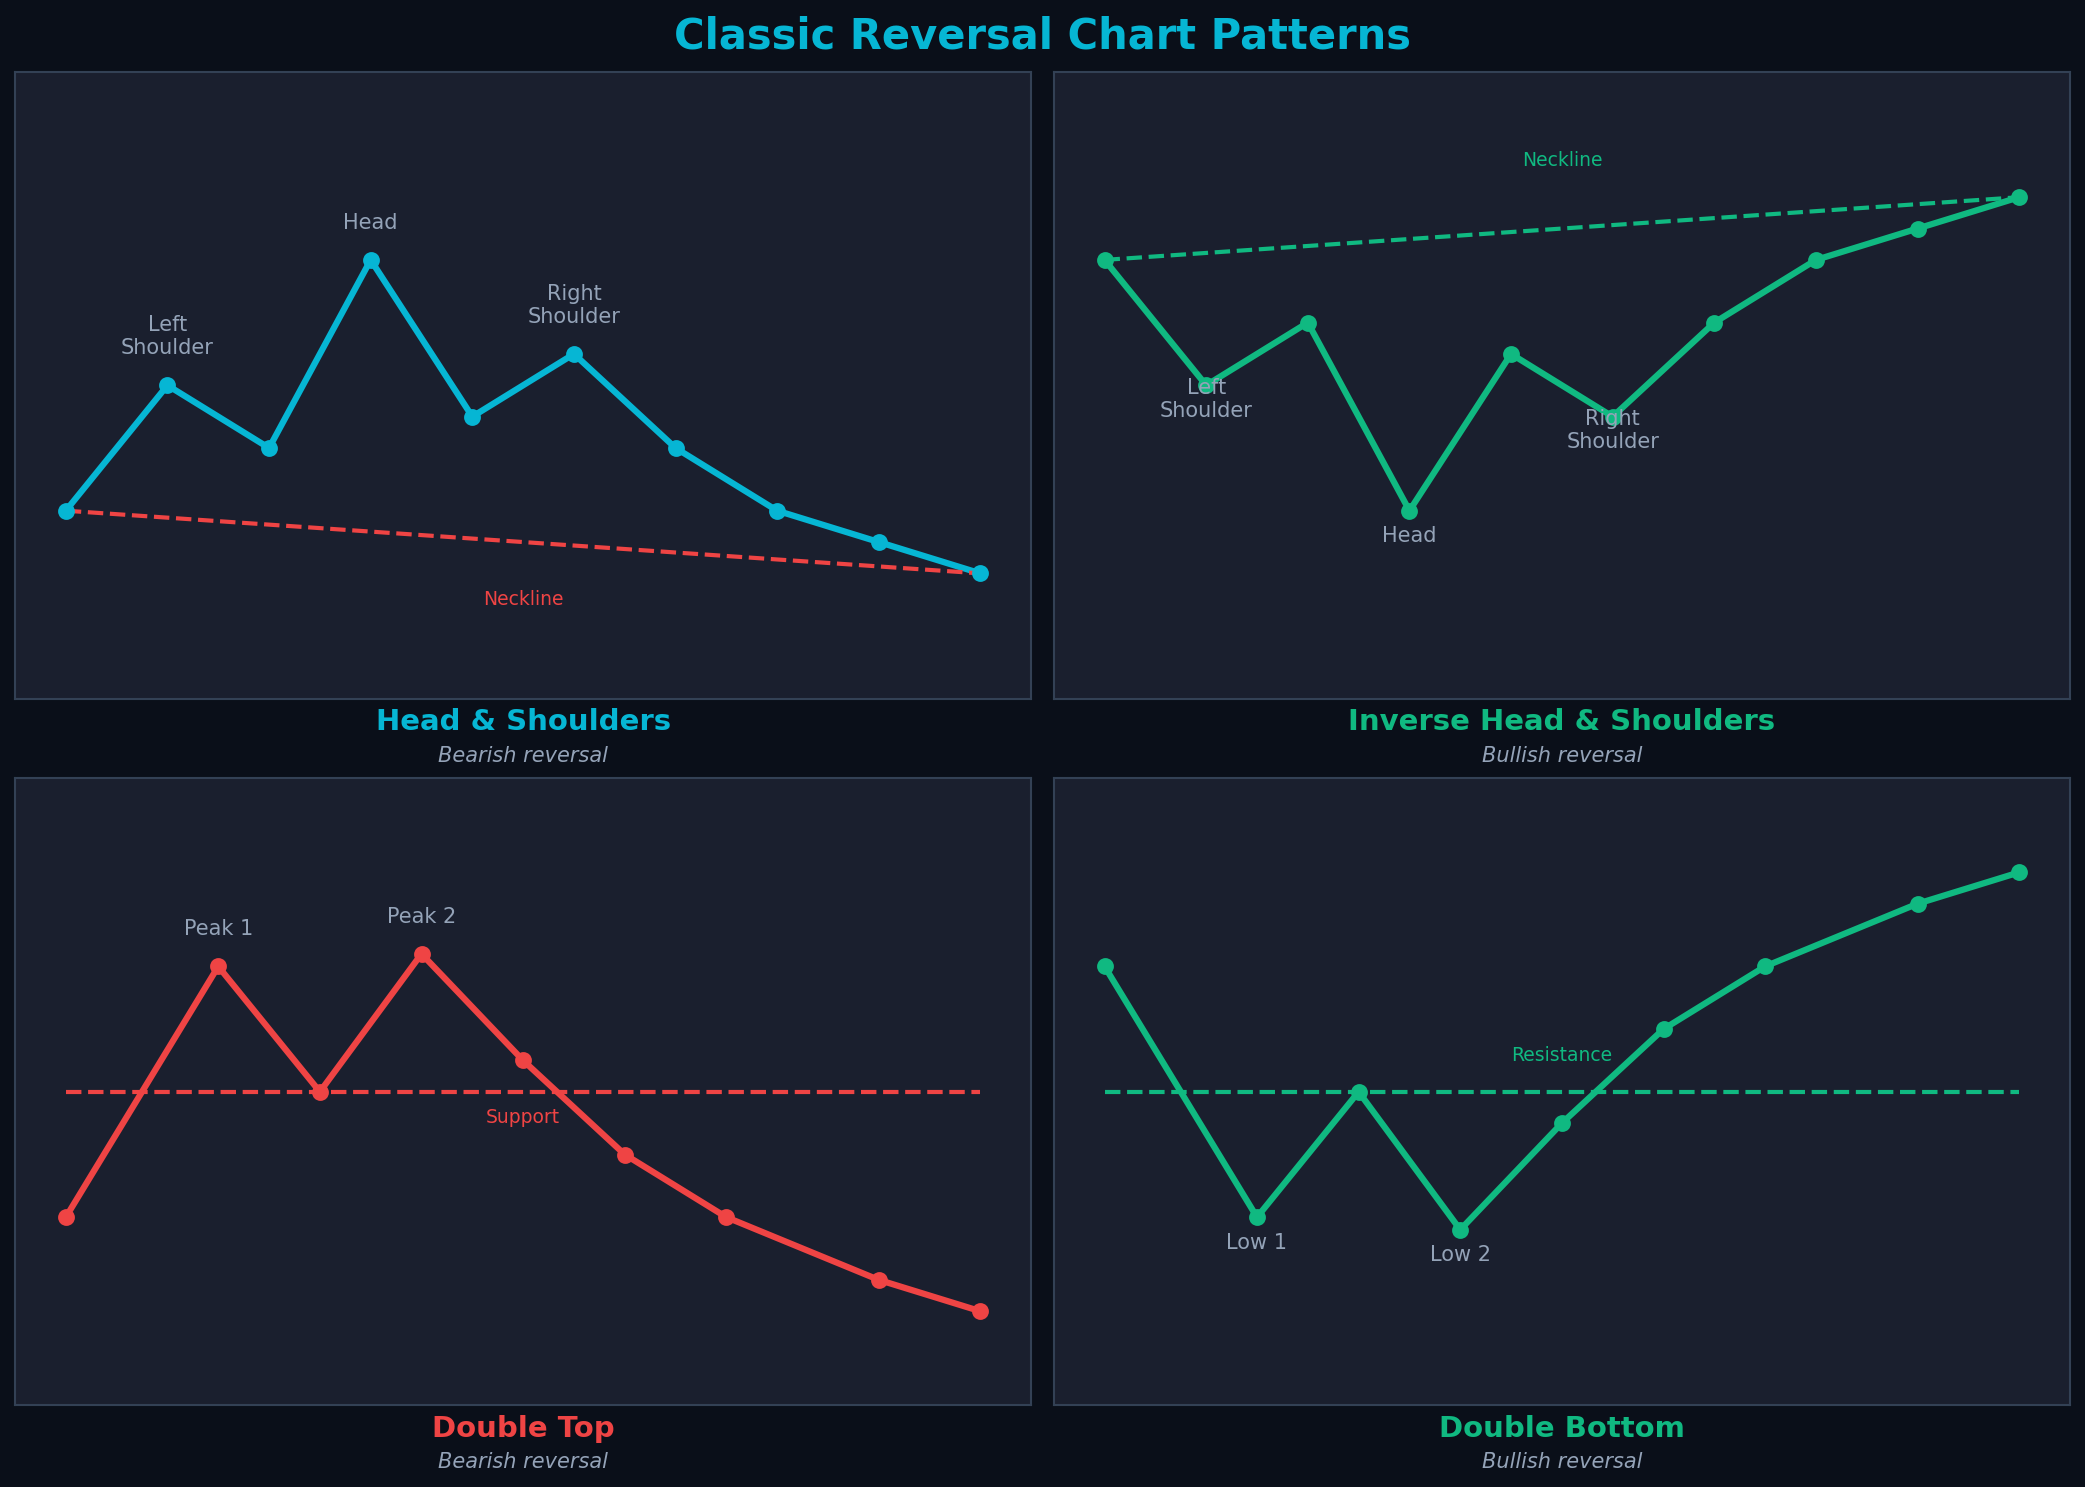
Classic head and shoulders patterns: bearish and bullish reversals
What is the Head and Shoulders Pattern?
The head and shoulders pattern is the most famous and reliable reversal pattern in technical analysis. It signals that an uptrend is ending and a downtrend is beginning. The pattern consists of three peaks: a left shoulder, a higher middle peak (the head), and a right shoulder that's similar in height to the left shoulder.
This pattern works because it shows a clear shift in market psychology. The left shoulder shows buyers still in control. The head shows buyers making one final push to new highs. The right shoulder shows buyers failing to reach the previous high—a sign of weakening momentum. When the neckline breaks, sellers take control.
💡 Success Rate
Head and shoulders patterns at major resistance levels with volume confirmation have 75-85% success rates—making them one of the most reliable patterns in technical analysis.
Classic Head and Shoulders (Bearish)
Pattern Components
- Left Shoulder: Price rallies to a peak, then pulls back
- Head: Price rallies to a higher peak, then pulls back again
- Right Shoulder: Price rallies but fails to reach head height, then declines
- Neckline: Support line connecting the two troughs between peaks
- Breakdown: Price breaks below neckline, confirming the pattern
Recognition Rules
- Prior Uptrend: Pattern must form after a sustained uptrend (minimum 2-3 months)
- Three Peaks: Left shoulder, head (highest), right shoulder (similar to left)
- Head Higher: Head must be noticeably higher than both shoulders
- Symmetry: Shoulders should be roughly equal in height and time
- Neckline: Can be horizontal, upward sloping, or downward sloping
- Volume: Should decrease from left shoulder to head to right shoulder
- Breakdown Volume: Should increase significantly on neckline break
Market Psychology
Left Shoulder: Bulls are in control, pushing to new highs. Profit-taking causes a pullback, but buyers see it as a buying opportunity.
Head: Bulls make one final push, creating a new high. This attracts late buyers (often retail traders). Smart money starts distributing, causing another pullback.
Right Shoulder: Bulls attempt another rally but fail to reach the head's height. This failure signals exhaustion. Buyers are losing conviction.
Neckline Break: When price breaks below the neckline, it confirms that sellers have taken control. Stop losses trigger, accelerating the decline.
Trading Rules
Entry: Sell/short when price closes below neckline
Stop Loss: Above right shoulder high (or above head for aggressive traders)
Target: Measure head to neckline distance, project down from breakdown point
Volume: Must increase on neckline break for confirmation
Pullback: 40-50% of patterns pull back to neckline—can add to position
Measuring Price Target
Step 1: Measure vertical distance from head peak to neckline
Step 2: Project this distance downward from the neckline breakdown point
Example: Head at $100, neckline at $90 = $10 distance. Breakdown at $90, target = $80
Note: This is a minimum target. Many patterns exceed this projection, especially with strong volume.
Inverse Head and Shoulders (Bullish)
Pattern Components
- Left Shoulder: Price declines to a trough, then rallies
- Head: Price declines to a lower trough, then rallies again
- Right Shoulder: Price declines but doesn't reach head depth, then rallies
- Neckline: Resistance line connecting the two peaks between troughs
- Breakout: Price breaks above neckline, confirming the pattern
Recognition Rules
- Prior Downtrend: Pattern must form after a sustained downtrend
- Three Troughs: Left shoulder, head (lowest), right shoulder (similar to left)
- Head Lower: Head must be noticeably lower than both shoulders
- Symmetry: Shoulders should be roughly equal in depth and time
- Neckline: Can be horizontal, upward sloping, or downward sloping
- Volume: Should decrease from left shoulder to right shoulder
- Breakout Volume: Should increase significantly on neckline break
Market Psychology
The inverse head and shoulders shows the opposite psychology. Bears are exhausting themselves, making lower lows. The right shoulder's failure to reach the head's depth shows sellers losing control. The neckline breakout confirms buyers have taken over.
Trading Rules
Entry: Buy when price closes above neckline
Stop Loss: Below right shoulder low (or below head for aggressive traders)
Target: Measure head to neckline distance, project up from breakout point
Volume: Must increase on neckline break for confirmation
Pullback: Can pull back to neckline—opportunity to add
Neckline Variations
The neckline is critical to the pattern. Its slope affects the pattern's reliability and price target accuracy.
Horizontal Neckline
Most Common: Neckline is flat
Reliability: High (80%+)
Target: Most accurate projection
Upward Sloping
Bullish Bias: Shows underlying strength
Reliability: Moderate (70%)
Note: Breakdown may be less severe
Downward Sloping
Bearish Bias: Shows underlying weakness
Reliability: Very High (85%+)
Note: Often leads to sharp declines
Volume Analysis
Volume is crucial for confirming head and shoulders patterns. The ideal volume pattern shows declining participation during formation and explosive volume on the breakout.
Ideal Volume Pattern
- Left Shoulder: High volume on rally, moderate on pullback
- Head: Lower volume than left shoulder (shows weakening momentum)
- Right Shoulder: Even lower volume (confirms exhaustion)
- Neckline Break: Volume spike 50-100% above average (confirms breakdown)
- Pullback: Low volume on pullback to neckline (shows weak buying)
⚠️ Volume Warning
If volume increases on the right shoulder or is low on the neckline break, the pattern is weak and may fail. Always wait for volume confirmation before trading.
Advanced Trading Strategies
Strategy 1: Conservative Entry
Entry: Wait for close below neckline AND pullback to neckline that fails
Confirmation: Pullback should be on low volume and fail at neckline resistance
Stop: Above neckline (tighter stop than aggressive entry)
Advantage: Higher win rate (85%+), better risk-reward, confirms pattern validity
Strategy 2: Aggressive Entry
Entry: Short at right shoulder peak (before neckline break)
Confirmation: Right shoulder fails to reach head height with declining volume
Stop: Above head high
Advantage: Better entry price, larger profit potential. Risk: Pattern may fail
Strategy 3: Scale-In Approach
Position 1 (50%): Enter on neckline break with volume confirmation
Position 2 (50%): Add on pullback to neckline that fails
Stop: Below entry for position 1, above neckline for position 2
Advantage: Balances risk and reward, averages better entry price
Common Mistakes to Avoid
❌ Trading Without Prior Trend
Head and shoulders is a REVERSAL pattern. It needs a sustained trend to reverse. Patterns in sideways markets are unreliable.
❌ Ignoring Volume
Volume must decline during formation and spike on breakout. Without this, the pattern has low reliability.
❌ Forcing the Pattern
Not every three-peak formation is a head and shoulders. The head must be clearly higher, shoulders roughly equal, and neckline well-defined.
❌ Entering Before Neckline Break
Many patterns fail before completing. Always wait for neckline break confirmation unless using aggressive strategy with proper stops.
❌ Ignoring Time Frame
Patterns on daily/weekly charts are more reliable than intraday patterns. Minimum formation time should be 2-3 months.
❌ Not Using Stop Losses
Even reliable patterns fail 15-25% of the time. Always use stops above right shoulder (bearish) or below right shoulder (bullish).
Pattern Variations
Complex Head and Shoulders
Multiple Shoulders: Pattern can have two left shoulders or two right shoulders
Multiple Heads: Rare but possible—two peaks at similar height forming the head
Reliability: Slightly lower than classic pattern but still valid if other rules met
Failed Head and Shoulders
Definition: Pattern forms but price doesn't break neckline, or breaks then reverses
Signal: Failed bearish pattern often leads to strong rally (and vice versa)
Trading: If pattern fails, consider reversing position—failure often signals strong move opposite direction
Key Takeaways
- Head and shoulders is the most reliable reversal pattern (75-85% success rate)
- Requires prior trend: uptrend for bearish, downtrend for bullish
- Three peaks/troughs: left shoulder, head (highest/lowest), right shoulder
- Shoulders should be roughly equal in height and time
- Volume should decline during formation, spike on neckline break
- Neckline break confirms pattern—wait for close beyond neckline
- Price target: measure head to neckline, project from breakdown point
- 40-50% of patterns pull back to neckline—opportunity to add
- Downward sloping neckline is most bearish, upward sloping least bearish
- Pattern takes 2-6 months to form—patience required
Conclusion
The head and shoulders pattern is the gold standard of reversal patterns. Its high success rate, clear entry and exit rules, and measurable price targets make it a favorite among professional traders. The pattern works because it captures a complete shift in market psychology from bullish to bearish (or vice versa for inverse).
The key to trading this pattern successfully is patience and discipline. Wait for the pattern to fully form, confirm with volume, and enter only after the neckline breaks. Use proper stop losses and take profits at the measured target. When combined with other technical analysis tools like support/resistance and trend analysis, head and shoulders patterns provide some of the highest probability trades available.
Master this pattern through extensive practice. Study hundreds of historical examples, measure their success rates, and develop strict entry rules. The head and shoulders pattern will become one of your most powerful trading tools.
Continue your chart pattern education
Next, explore double top and double bottom patterns for simpler but equally powerful reversal signals. Also review three-candle patterns to combine with chart patterns for maximum edge.
Related Patterns
Ready to Put This Into Practice?
Join MarketDly to access real-time market insights, AI-powered analysis, and professional trading tools.
No credit card required • Free tier available • Upgrade anytime