Wedge Patterns: Rising & Falling Wedges Trading Guide
Master wedge patterns for powerful reversal signals with 65-70% success rates at trend exhaustion points
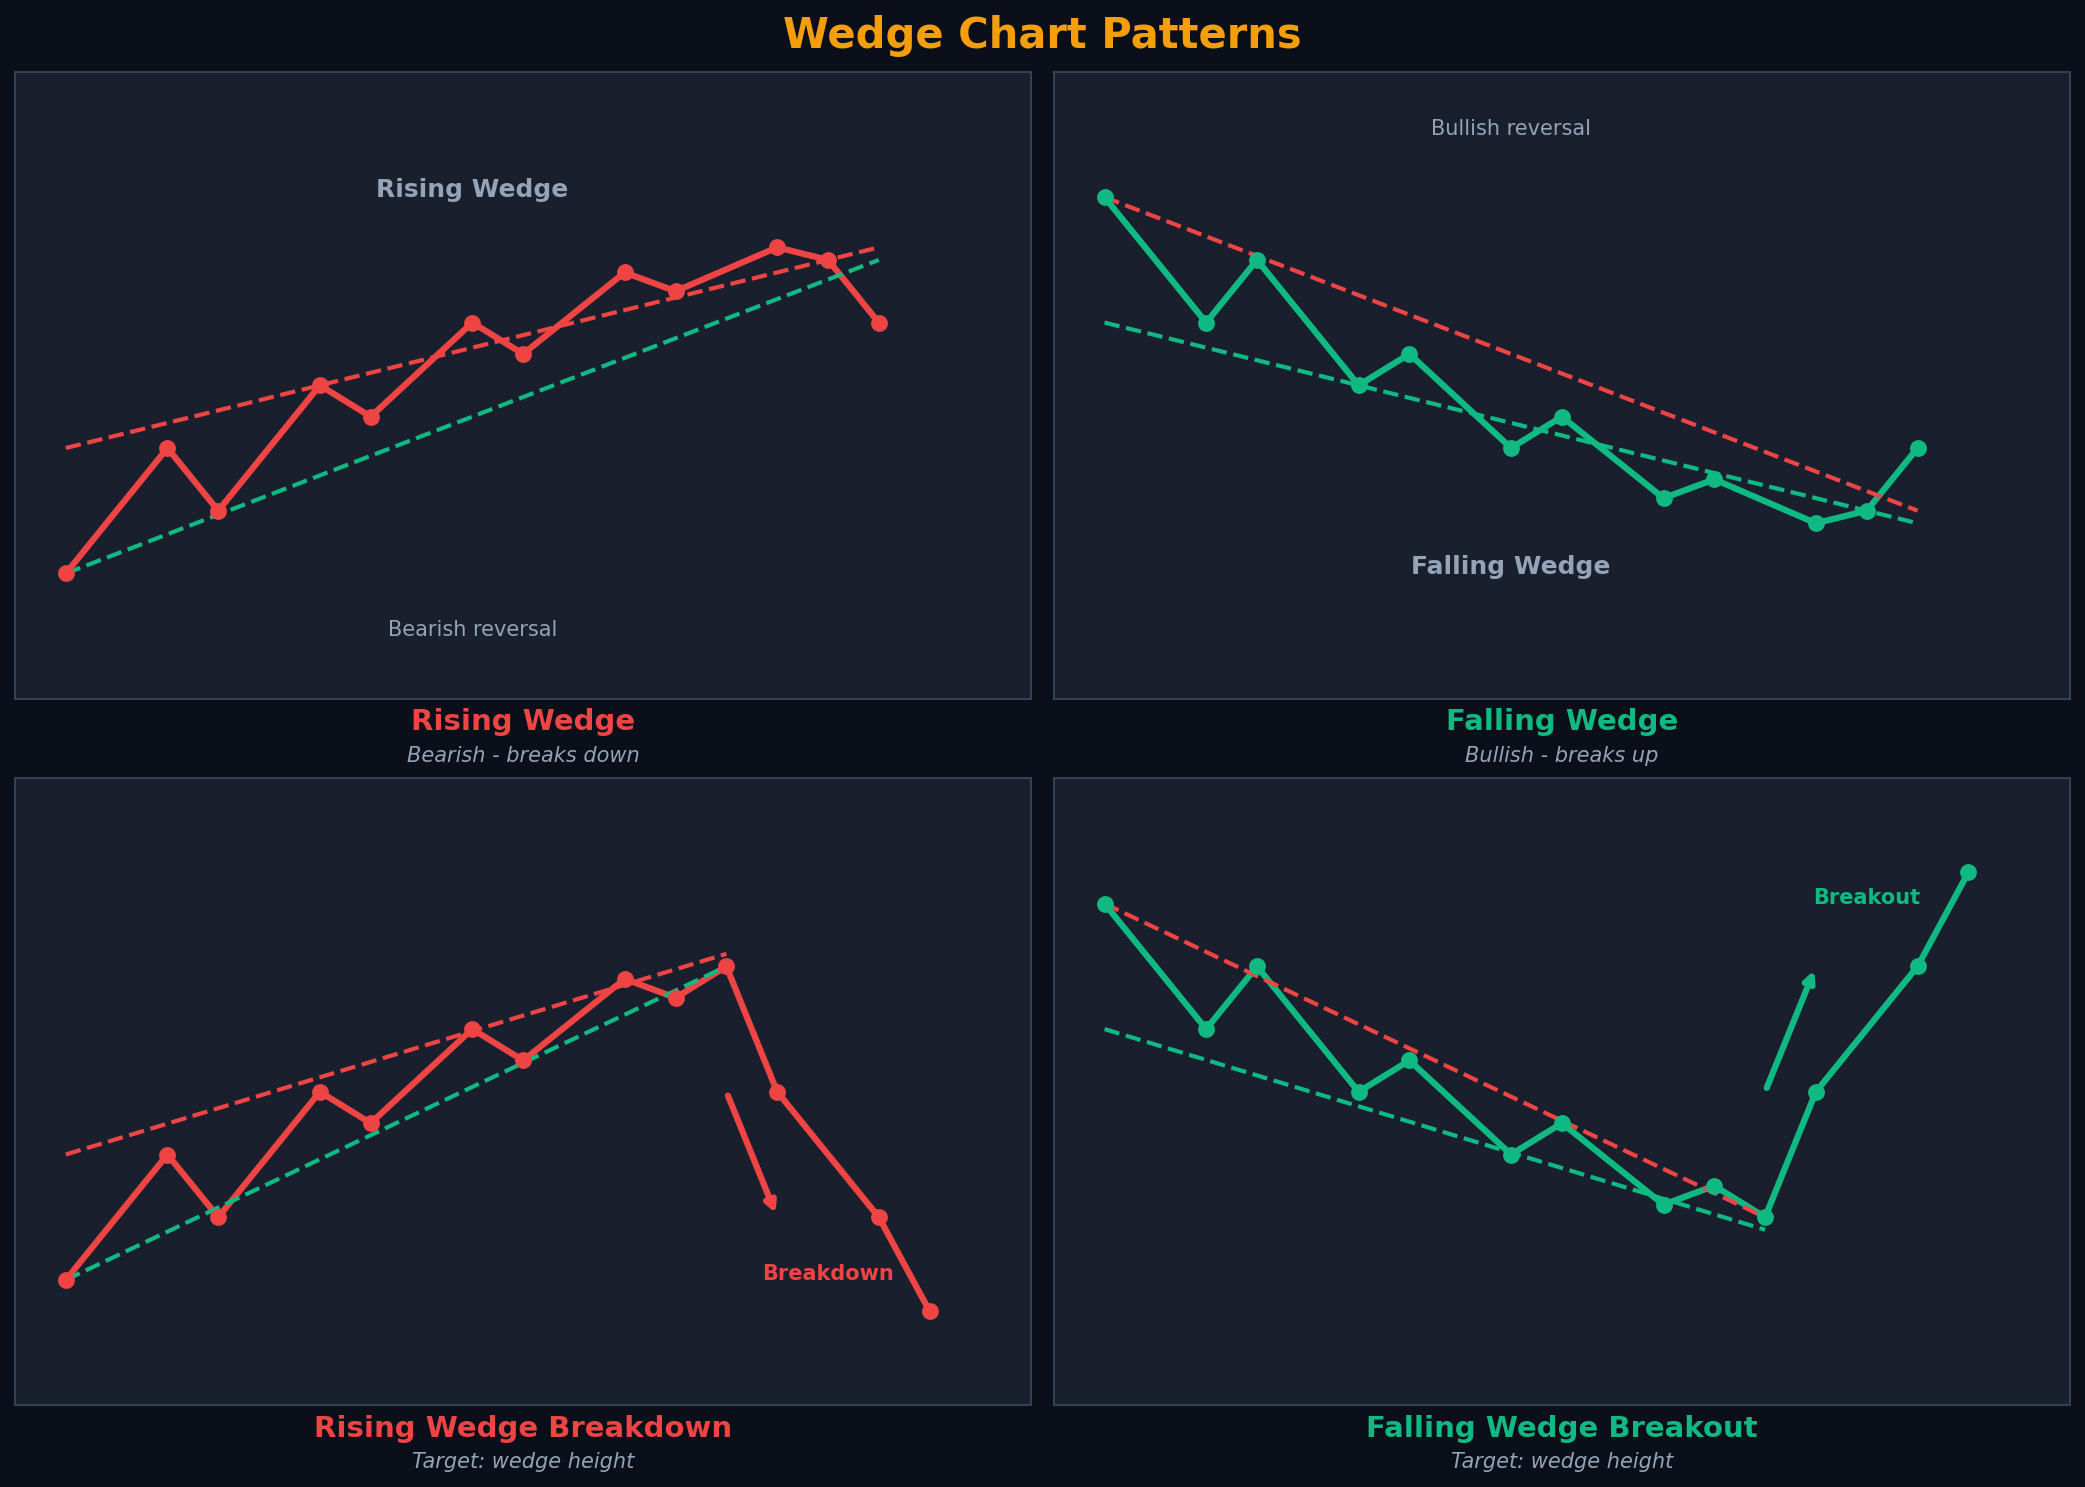
Rising and falling wedge patterns with breakout targets
Understanding Wedge Patterns
Wedge patterns are reversal patterns that form when price consolidates between two converging trendlines that slope in the same direction. Unlike triangles where lines converge from opposite directions, wedge trendlines both slope up (rising wedge) or both slope down (falling wedge). This creates a narrowing price range that signals trend exhaustion.
The key insight: rising wedges are bearish (despite upward slope), and falling wedges are bullish (despite downward slope). This counterintuitive nature makes wedges powerful—they trap traders on the wrong side before reversing sharply.
💡 Success Rates
Rising wedges: 65-70% break down. Falling wedges: 65-70% break up. Best at major support/resistance with volume confirmation.
Rising Wedge (Bearish)
Pattern Structure
- Both Lines Rise: Support and resistance both slope upward
- Converging: Lines meet at apex (narrowing range)
- Support Steeper: Lower line rises faster than upper line
- Duration: 3-6 months typical (can be 1-12 months)
- Breakdown: Price breaks below support with volume
Market Psychology
Rising wedges show buyers losing momentum. Each rally is weaker (lower highs relative to lows), and each pullback is shallower (higher lows). The narrowing range shows indecision. When support breaks, trapped bulls panic-sell, accelerating the decline.
Trading Strategy
Entry: Sell/short on close below support line
Stop Loss: Above recent high or resistance line
Target: Measure wedge height (widest point), subtract from breakdown
Volume: Should decline during formation, spike on breakdown
Success Rate: 65-70% reach target
Falling Wedge (Bullish)
Pattern Structure
- Both Lines Fall: Support and resistance both slope downward
- Converging: Lines meet at apex (narrowing range)
- Resistance Steeper: Upper line falls faster than lower line
- Duration: 3-6 months typical
- Breakout: Price breaks above resistance with volume
Market Psychology
Falling wedges show sellers losing momentum. Each decline is weaker (higher lows relative to highs), and each bounce is stronger (lower highs). The narrowing range shows bears exhausting. When resistance breaks, trapped shorts cover, accelerating the rally.
Trading Strategy
Entry: Buy on close above resistance line
Stop Loss: Below recent low or support line
Target: Measure wedge height, add to breakout point
Volume: Should decline during formation, spike on breakout
Success Rate: 65-70% reach target
Key Takeaways
- Wedges are reversal patterns with 65-70% success rates
- Rising wedge: both lines slope up, breaks down (bearish)
- Falling wedge: both lines slope down, breaks up (bullish)
- Duration: 3-6 months typical (minimum 3 weeks)
- Volume declines during formation, spikes on breakout
- Target: measure widest part of wedge, project from break
- Minimum 2 touches on each trendline required
- Breakout usually occurs at 2/3 to 3/4 of wedge length
- Most reliable at major support/resistance levels
- Always use stops: opposite side of wedge
Conclusion
Wedge patterns are powerful reversal signals that catch traders off guard. Their counterintuitive nature—rising wedges break down, falling wedges break up—creates strong moves as trapped traders exit positions. The key is patience: wait for the pattern to fully form and break with volume confirmation.
Continue your pattern education
Next, explore rectangle and channel patterns. Also review triangle patterns for continuation signals.
Related Patterns
Ready to Put This Into Practice?
Join MarketDly to access real-time market insights, AI-powered analysis, and professional trading tools.
No credit card required • Free tier available • Upgrade anytime