Flags & Pennants: Short-Term Continuation Patterns
Master quick continuation patterns for trending markets with 70-80% success rates and rapid profit potential
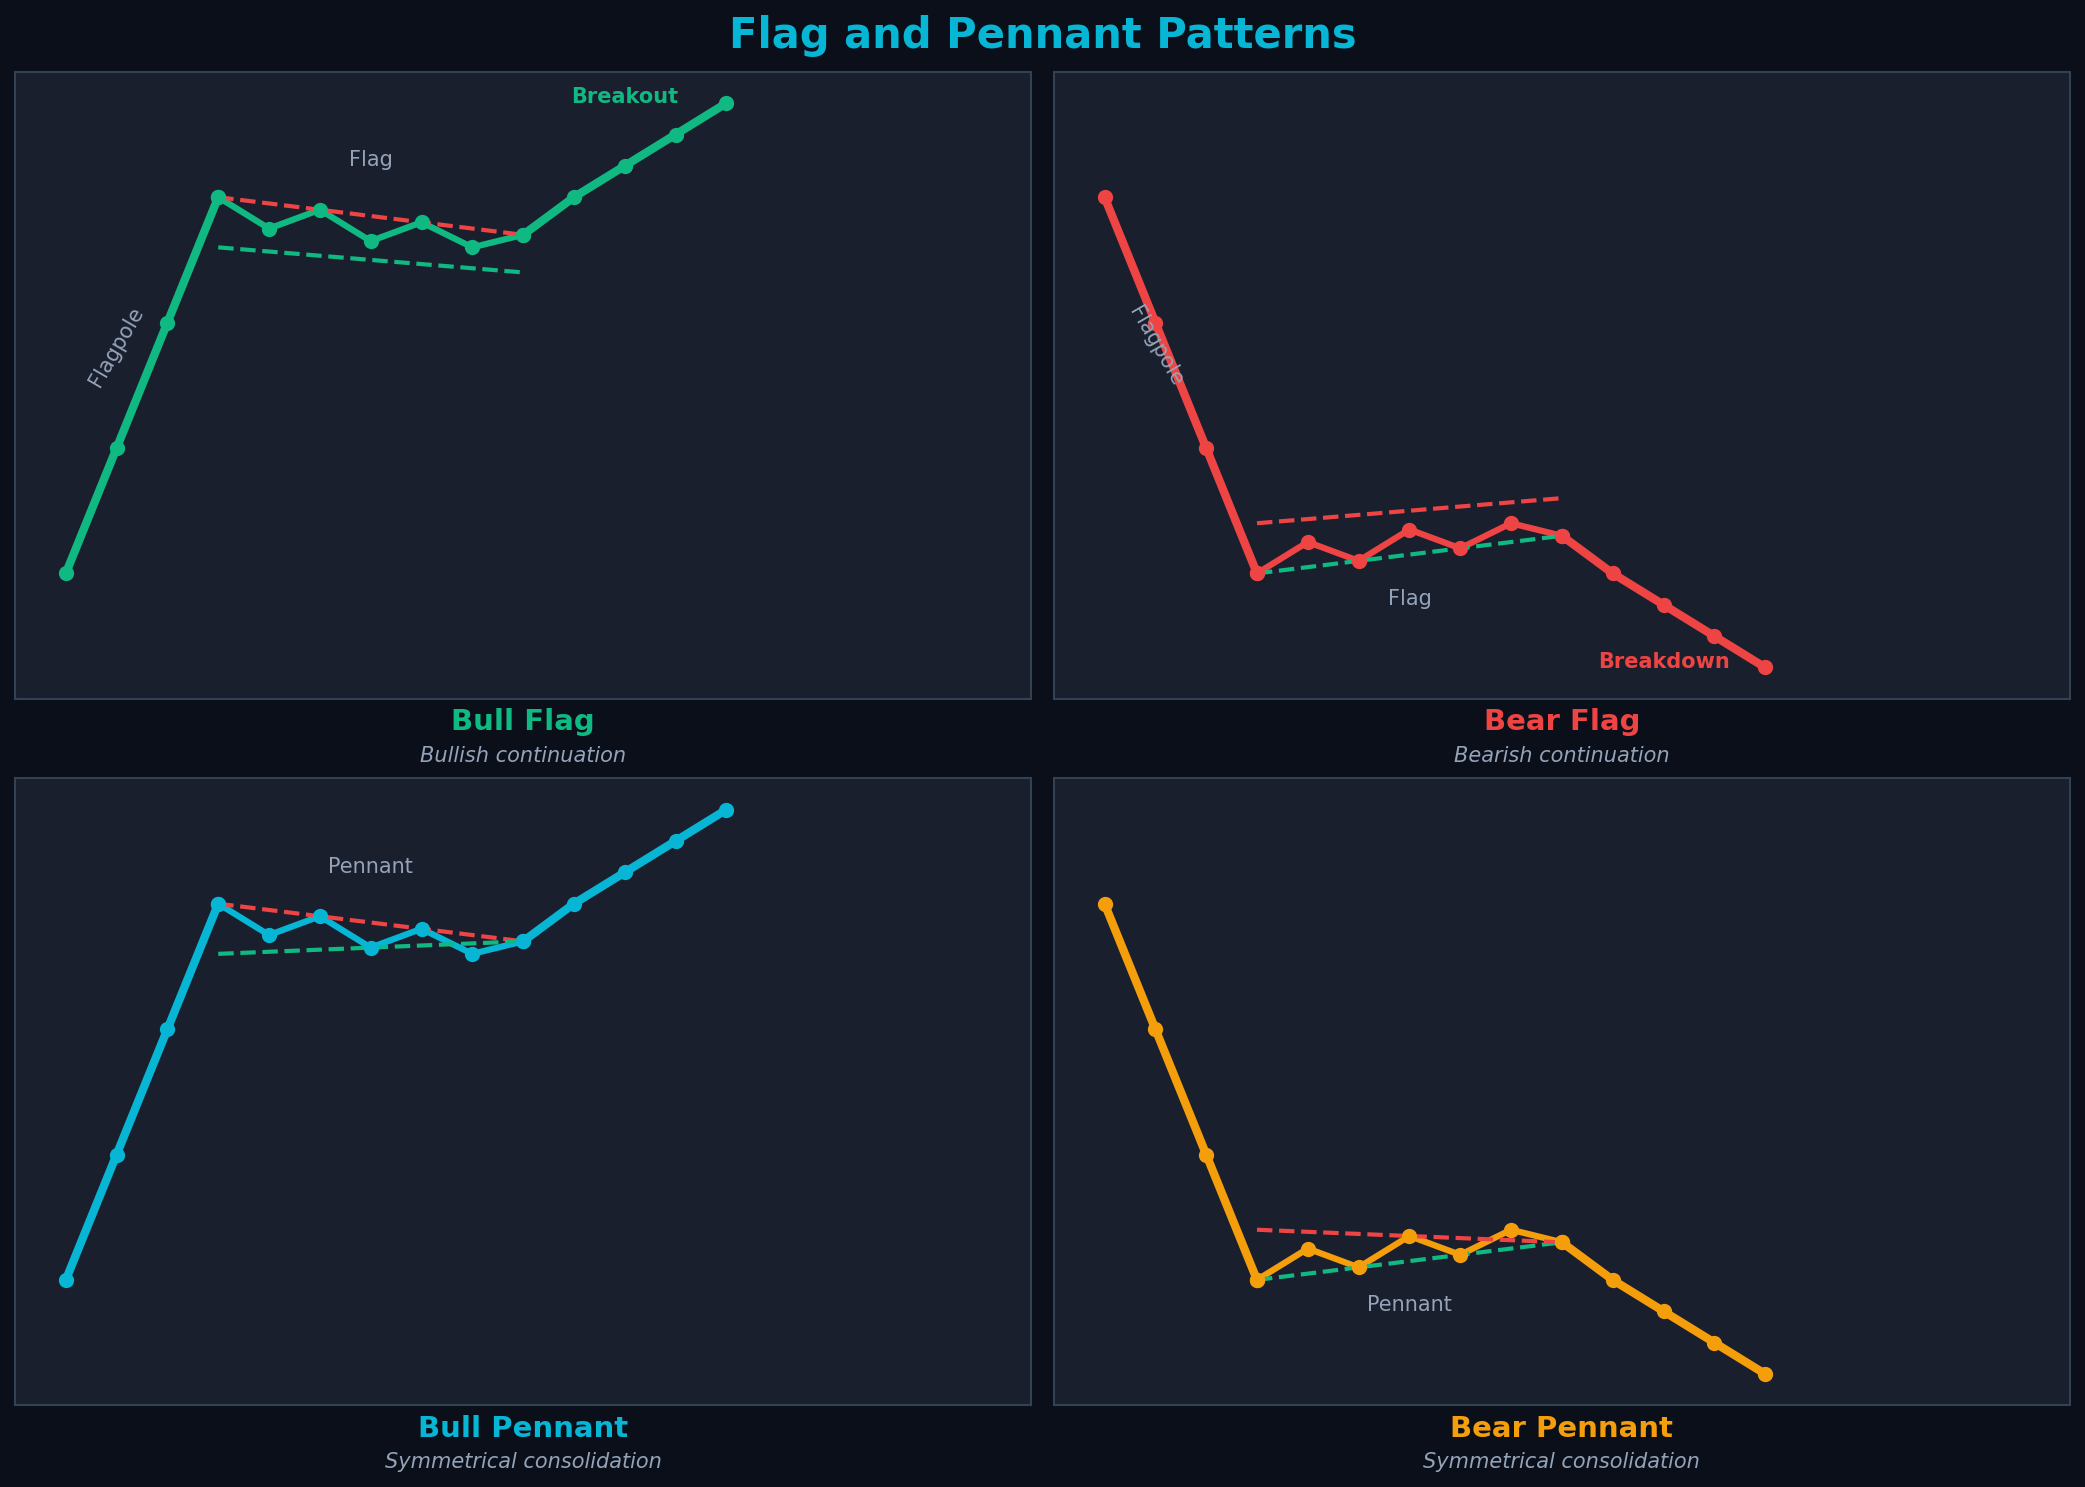
Bull and bear flags and pennants for continuation trading
Understanding Flags and Pennants
Flags and pennants are short-term continuation patterns that form during strong trends. They represent brief pauses or consolidations before the trend resumes. These patterns are characterized by a sharp price move (the flagpole) followed by a small consolidation (the flag or pennant) and then a breakout continuing the original trend.
The key difference: flags have parallel trendlines (rectangular shape), while pennants have converging trendlines (small triangle). Both signal the same thing—a brief rest before the trend continues. These patterns form quickly (1-3 weeks) and provide excellent risk-reward opportunities.
💡 Success Rates
Bull flags: 70-75% continue upward. Bear flags: 70-75% continue downward. Pennants: 70-80% continuation in trend direction. Best in strong trends with high volume.
Bull Flag Pattern
Pattern Structure
- Flagpole: Sharp upward move (30%+ in 1-4 weeks)
- Flag: Downward sloping consolidation with parallel lines
- Duration: 1-3 weeks typical (maximum 4 weeks)
- Volume: High on flagpole, declining during flag
- Breakout: Above flag resistance with volume spike
Recognition Rules
- Strong Uptrend: Must have sharp rally before flag forms
- Flagpole Angle: Should be steep (45-70 degrees)
- Flag Slope: Downward or horizontal (never upward)
- Retracement: Flag retraces 38-50% of flagpole
- Volume Pattern: Declining during flag, expanding on breakout
- Time Limit: If flag lasts >4 weeks, pattern fails
Trading Strategy
Entry: Buy on close above flag resistance
Stop Loss: Below flag low (tight stop possible)
Target: Measure flagpole height, add to breakout point
Volume: Must spike 50%+ on breakout
Time Frame: Best on daily charts, works on 4-hour
Bear Flag Pattern
Pattern Structure
- Flagpole: Sharp downward move (30%+ in 1-4 weeks)
- Flag: Upward sloping consolidation with parallel lines
- Duration: 1-3 weeks typical
- Volume: High on flagpole, declining during flag
- Breakdown: Below flag support with volume spike
Trading Strategy
Entry: Sell/short on close below flag support
Stop Loss: Above flag high
Target: Measure flagpole height, subtract from breakdown
Volume: Must increase on breakdown
Note: Bear flags often more reliable than bull flags
Pennant Patterns
Pattern Structure
- Flagpole: Sharp move in either direction
- Pennant: Small symmetrical triangle (converging lines)
- Duration: 1-3 weeks (shorter than flags)
- Volume: Declining during pennant formation
- Breakout: Continues flagpole direction
Key Differences from Flags
Shape: Pennants have converging lines (triangle), flags have parallel lines
Duration: Pennants typically shorter (1-2 weeks vs 2-3 weeks)
Reliability: Pennants slightly more reliable (75-80% vs 70-75%)
Trading: Same rules apply—measure flagpole, project from breakout
Common Mistakes
❌ Weak Flagpole
Flagpole must be sharp and strong (30%+ move). Gradual moves don't create valid flags.
❌ Flag Too Long
Flags lasting >4 weeks lose momentum and often fail. Quick consolidation is key.
❌ Wrong Slope
Bull flags should slope down or be horizontal. Upward sloping "flags" are not valid patterns.
❌ No Volume Confirmation
Breakouts without volume spike fail 50% of the time. Volume is critical.
❌ Deep Retracement
Flag should retrace 38-50% of flagpole. Deeper retracements (>60%) often fail.
Key Takeaways
- Flags and pennants are short-term continuation patterns (70-80% success)
- Require sharp flagpole (30%+ move in 1-4 weeks)
- Flags have parallel lines, pennants have converging lines
- Duration: 1-3 weeks (maximum 4 weeks)
- Bull flags slope down, bear flags slope up
- Volume declines during flag, spikes on breakout
- Target: measure flagpole height, project from breakout
- Flag retraces 38-50% of flagpole (not more)
- Best in strong trending markets with momentum
- Tight stops possible—flag low/high provides clear exit
Conclusion
Flags and pennants are essential patterns for trading strong trends. Their short formation time, clear structure, and high success rates make them ideal for active traders. The key is identifying the sharp flagpole first—without strong momentum, these patterns don't work.
Wait for the consolidation to complete and breakout to occur with volume confirmation. Use tight stops and take profits at the measured target. These patterns provide excellent risk-reward ratios (often 3:1 or better) because the stop is close and the target is the full flagpole height.
Continue your pattern education
Next, explore wedge patterns for reversal signals. Also review triangle patterns for longer-term continuation setups.
Related Patterns
Ready to Put This Into Practice?
Join MarketDly to access real-time market insights, AI-powered analysis, and professional trading tools.
No credit card required • Free tier available • Upgrade anytime