Triangle Patterns: Complete Trading Guide
Master ascending, descending, and symmetrical triangles for powerful continuation signals with 65-75% success rates
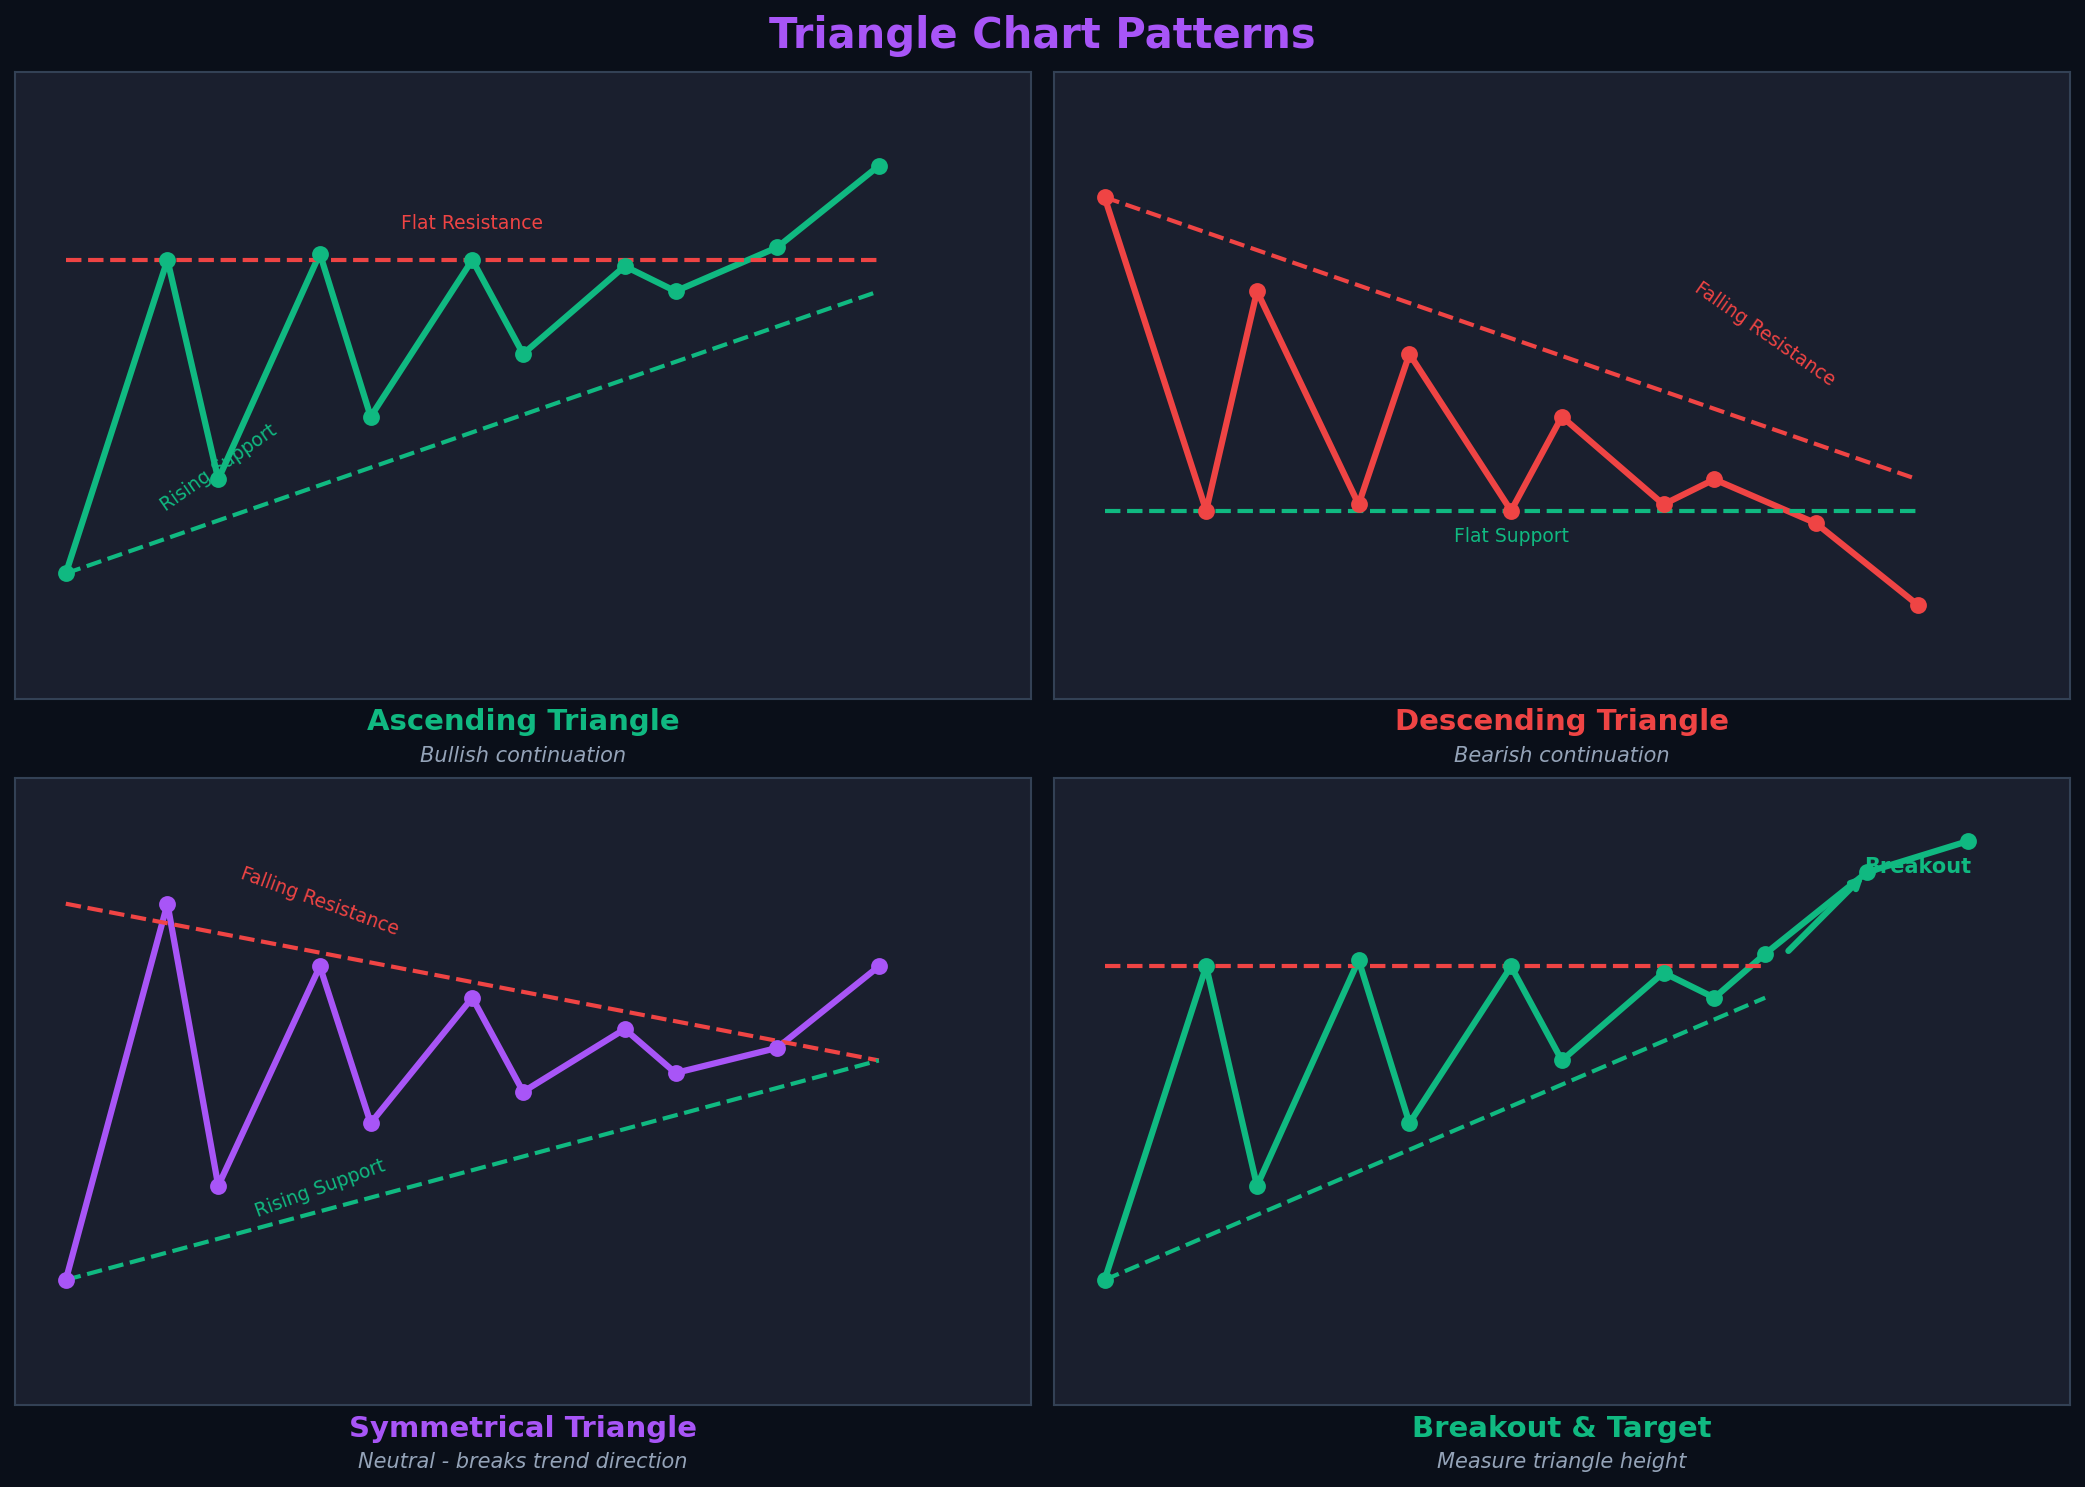
Three types of triangle patterns and breakout targets
Understanding Triangle Patterns
Triangle patterns are continuation patterns that form when price consolidates between converging trendlines. They represent a pause in the trend as buyers and sellers reach temporary equilibrium. The pattern completes when price breaks out of the triangle, typically continuing in the direction of the prior trend.
There are three types of triangles: ascending (bullish), descending (bearish), and symmetrical (neutral). Each has distinct characteristics and trading implications. Triangles typically form over 1-3 months and provide clear entry points, stop losses, and price targets.
💡 Success Rates
Ascending triangles: 70-75% bullish breakout. Descending triangles: 70-75% bearish breakdown. Symmetrical triangles: 65% continuation in trend direction.
Ascending Triangle (Bullish)
Pattern Structure
- Flat Resistance: Horizontal line at top connecting highs
- Rising Support: Upward sloping line connecting higher lows
- Converging Lines: Support rises toward resistance
- Bullish Bias: Buyers getting more aggressive with each low
- Breakout: Price breaks above resistance with volume
Recognition Rules
- Prior Uptrend: Forms during uptrend as consolidation
- Minimum Touches: 2 touches on resistance, 2 on support
- Duration: 1-3 months typical (minimum 3 weeks)
- Volume: Should contract during formation, expand on breakout
- Breakout Point: Usually occurs at 2/3 to 3/4 of triangle width
Trading Strategy
Entry: Buy on close above resistance with volume spike
Stop Loss: Below most recent swing low or below support line
Target: Measure triangle height (base), add to breakout point
Volume: Must be 50%+ above average on breakout
Success Rate: 70-75% reach target when volume confirms
Descending Triangle (Bearish)
Pattern Structure
- Flat Support: Horizontal line at bottom connecting lows
- Falling Resistance: Downward sloping line connecting lower highs
- Converging Lines: Resistance falls toward support
- Bearish Bias: Sellers getting more aggressive with each high
- Breakdown: Price breaks below support with volume
Trading Strategy
Entry: Sell/short on close below support with volume spike
Stop Loss: Above most recent swing high or above resistance line
Target: Measure triangle height, subtract from breakdown point
Volume: Must increase significantly on breakdown
Success Rate: 70-75% reach target with volume confirmation
Symmetrical Triangle (Neutral)
Pattern Structure
- Rising Support: Upward sloping line connecting higher lows
- Falling Resistance: Downward sloping line connecting lower highs
- Converging Lines: Both lines meet at apex
- Neutral Bias: Can break either direction
- Trend Continuation: Usually breaks in direction of prior trend (65%)
Trading Strategy
Entry: Wait for breakout direction, enter on close beyond trendline
Stop Loss: Opposite side of triangle
Target: Measure widest part of triangle, project from breakout
Volume: Critical for confirming breakout direction
Success Rate: 65% continuation, 35% reversal
Common Mistakes to Avoid
❌ Trading Before Breakout
30% of triangles fail. Always wait for confirmed breakout with volume before entering.
❌ Ignoring Volume
Breakouts without volume often fail. Volume must be 50%+ above average for valid breakout.
❌ Late Entry
Breakouts after 3/4 of triangle width are weak. Best breakouts occur at 2/3 to 3/4 point.
❌ Insufficient Touches
Need minimum 2 touches on each trendline. One touch is not a valid trendline.
❌ Wrong Time Frame
Triangles need 3+ weeks to form. Intraday triangles are unreliable. Use daily charts minimum.
Key Takeaways
- Triangles are continuation patterns with 65-75% success rates
- Ascending triangle: flat resistance + rising support = bullish
- Descending triangle: flat support + falling resistance = bearish
- Symmetrical triangle: converging lines = neutral, follows trend
- Minimum 2 touches on each trendline required
- Formation time: 1-3 months typical (minimum 3 weeks)
- Volume contracts during formation, expands on breakout
- Best breakouts occur at 2/3 to 3/4 of triangle width
- Target: measure triangle height, project from breakout point
- Always use stops: opposite side of triangle or recent swing
Conclusion
Triangle patterns are essential tools for trading consolidations within trends. Their clear structure, defined entry points, and measurable targets make them ideal for systematic trading. Ascending and descending triangles provide directional bias, while symmetrical triangles require patience to determine breakout direction.
The key to success is waiting for confirmed breakouts with volume. Don't anticipate—let the pattern complete. Use proper stop losses and take profits at the measured target. When combined with trend analysis and other technical tools, triangle patterns provide consistent, high-probability trading opportunities.
Continue your chart pattern education
Next, explore flags and pennants for short-term continuation patterns. Also review double tops and bottoms for reversal signals.
Related Patterns
Ready to Put This Into Practice?
Join MarketDly to access real-time market insights, AI-powered analysis, and professional trading tools.
No credit card required • Free tier available • Upgrade anytime