Single Moving Average Trading: The 50 MA and 200 MA Strategies
You don't need multiple moving averages to trade successfully. A single well-chosen MA can provide clear trend direction, dynamic support and resistance, and high-probability entry points. The 50-day and 200-day moving averages are the most watched levels in the market—and for good reason.
💡 Why Single MA Trading Works
Institutional traders, algorithms, and millions of retail traders watch the same key MAs. When price approaches these levels, buying and selling pressure concentrates, creating reliable support and resistance zones.
The Power of the 200-Day Moving Average
The 200 MA is the most important single indicator in technical analysis. It separates bull markets from bear markets and acts as a magnet for price action.
Why 200 Days?
The 200-day period represents approximately 40 trading weeks or 9-10 months of data. It captures:
- Multiple earnings cycles: 3-4 quarterly reports
- Seasonal patterns: Nearly a full year of trading
- Institutional positioning: Long-term fund rebalancing
- Market psychology: The "long-term" view for most traders
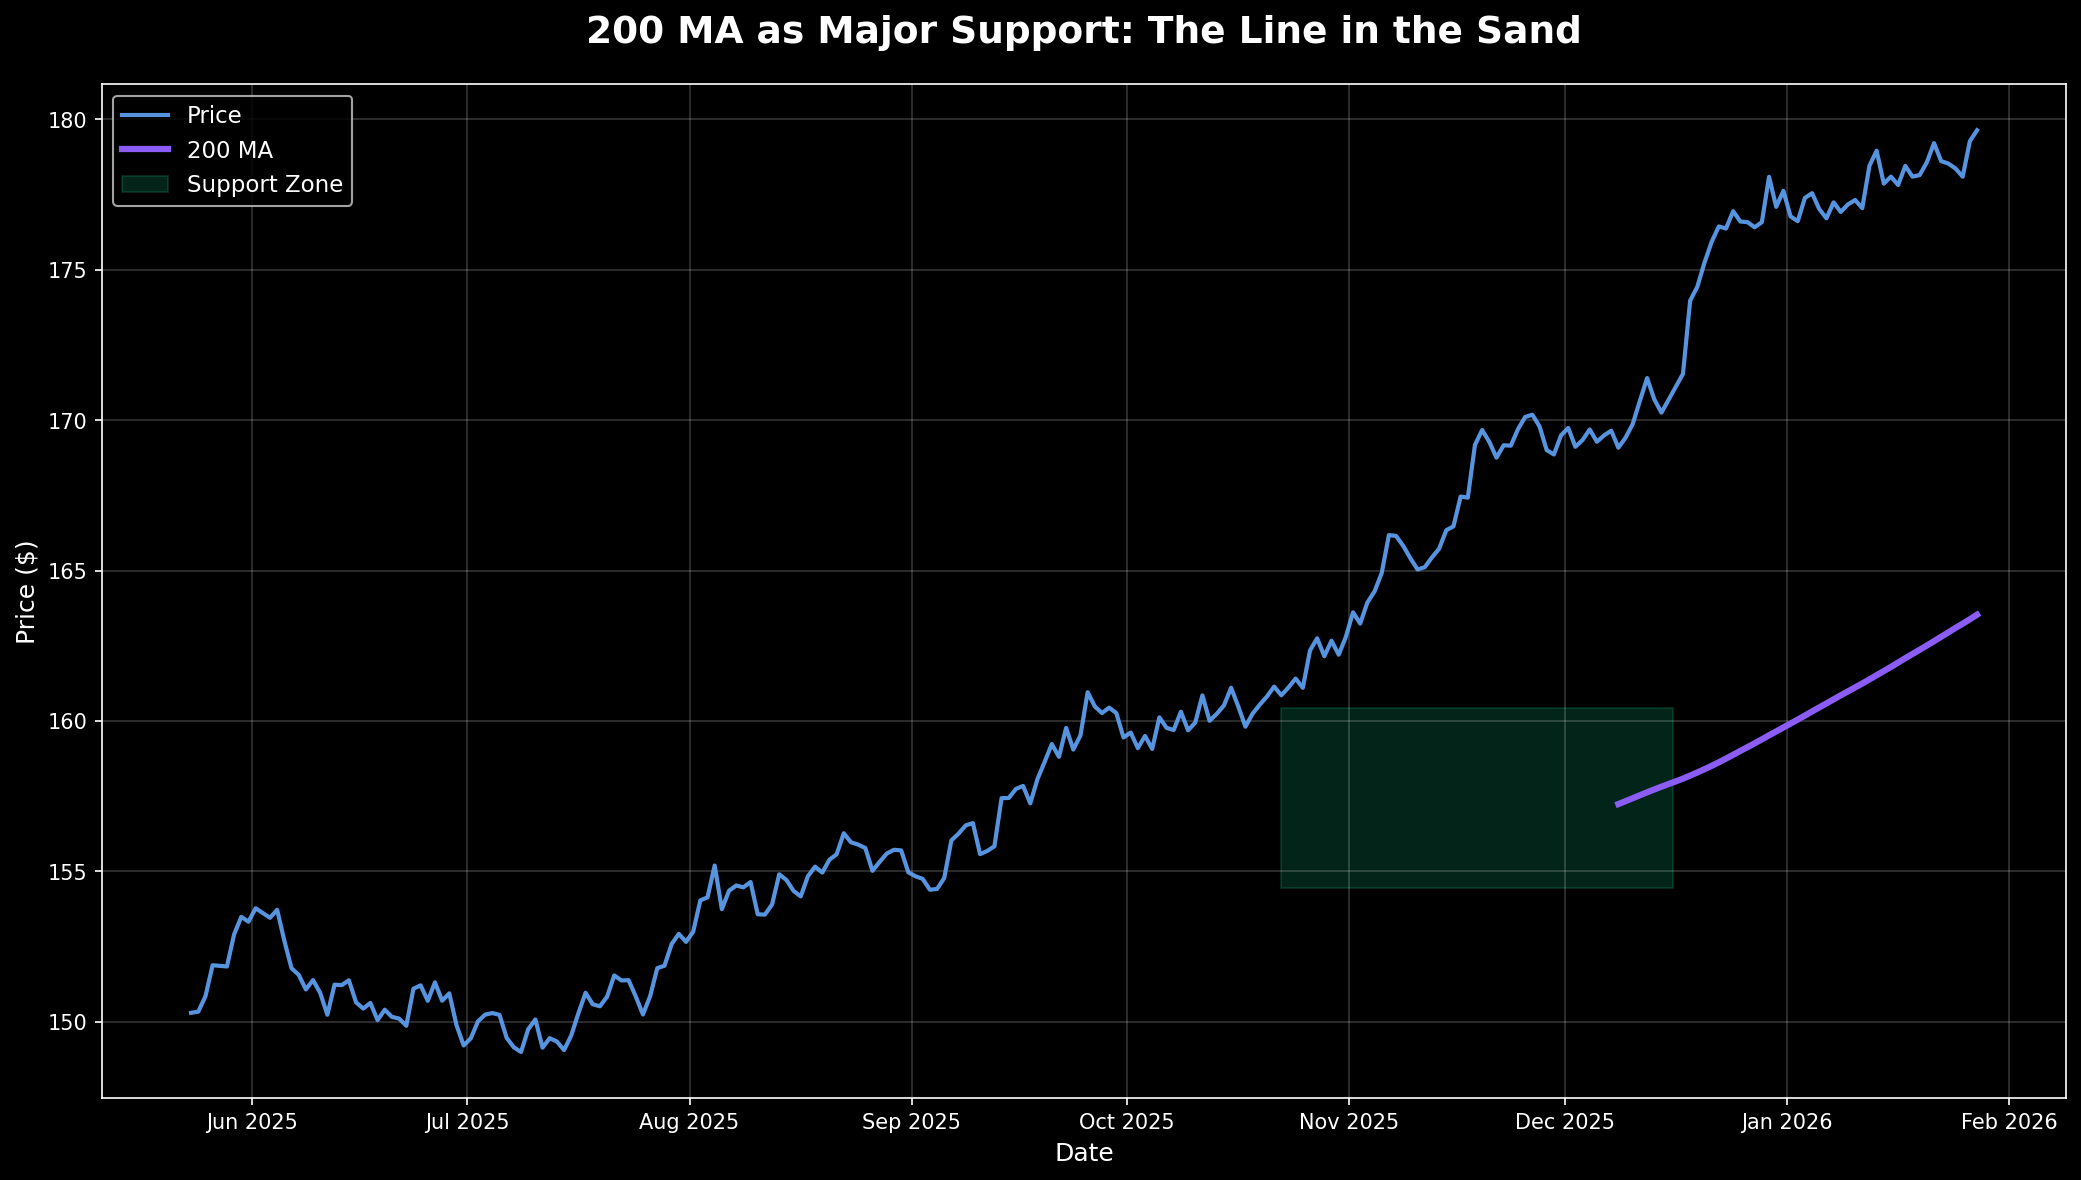
200 MA as Major Support/Resistance
When a stock is above its 200 MA, it's in a long-term uptrend. When below, it's in a downtrend. The 200 MA acts as:
In Uptrends (Price Above 200 MA):
- ✓ Major support level on pullbacks
- ✓ Buying opportunity for dip buyers
- ✓ Stop-loss reference for long positions
- ✓ Trend confirmation for new entries
In Downtrends (Price Below 200 MA):
- ✓ Major resistance on rallies
- ✓ Shorting opportunity for bears
- ✓ Warning sign for potential longs
- ✓ Trend confirmation for bearish trades
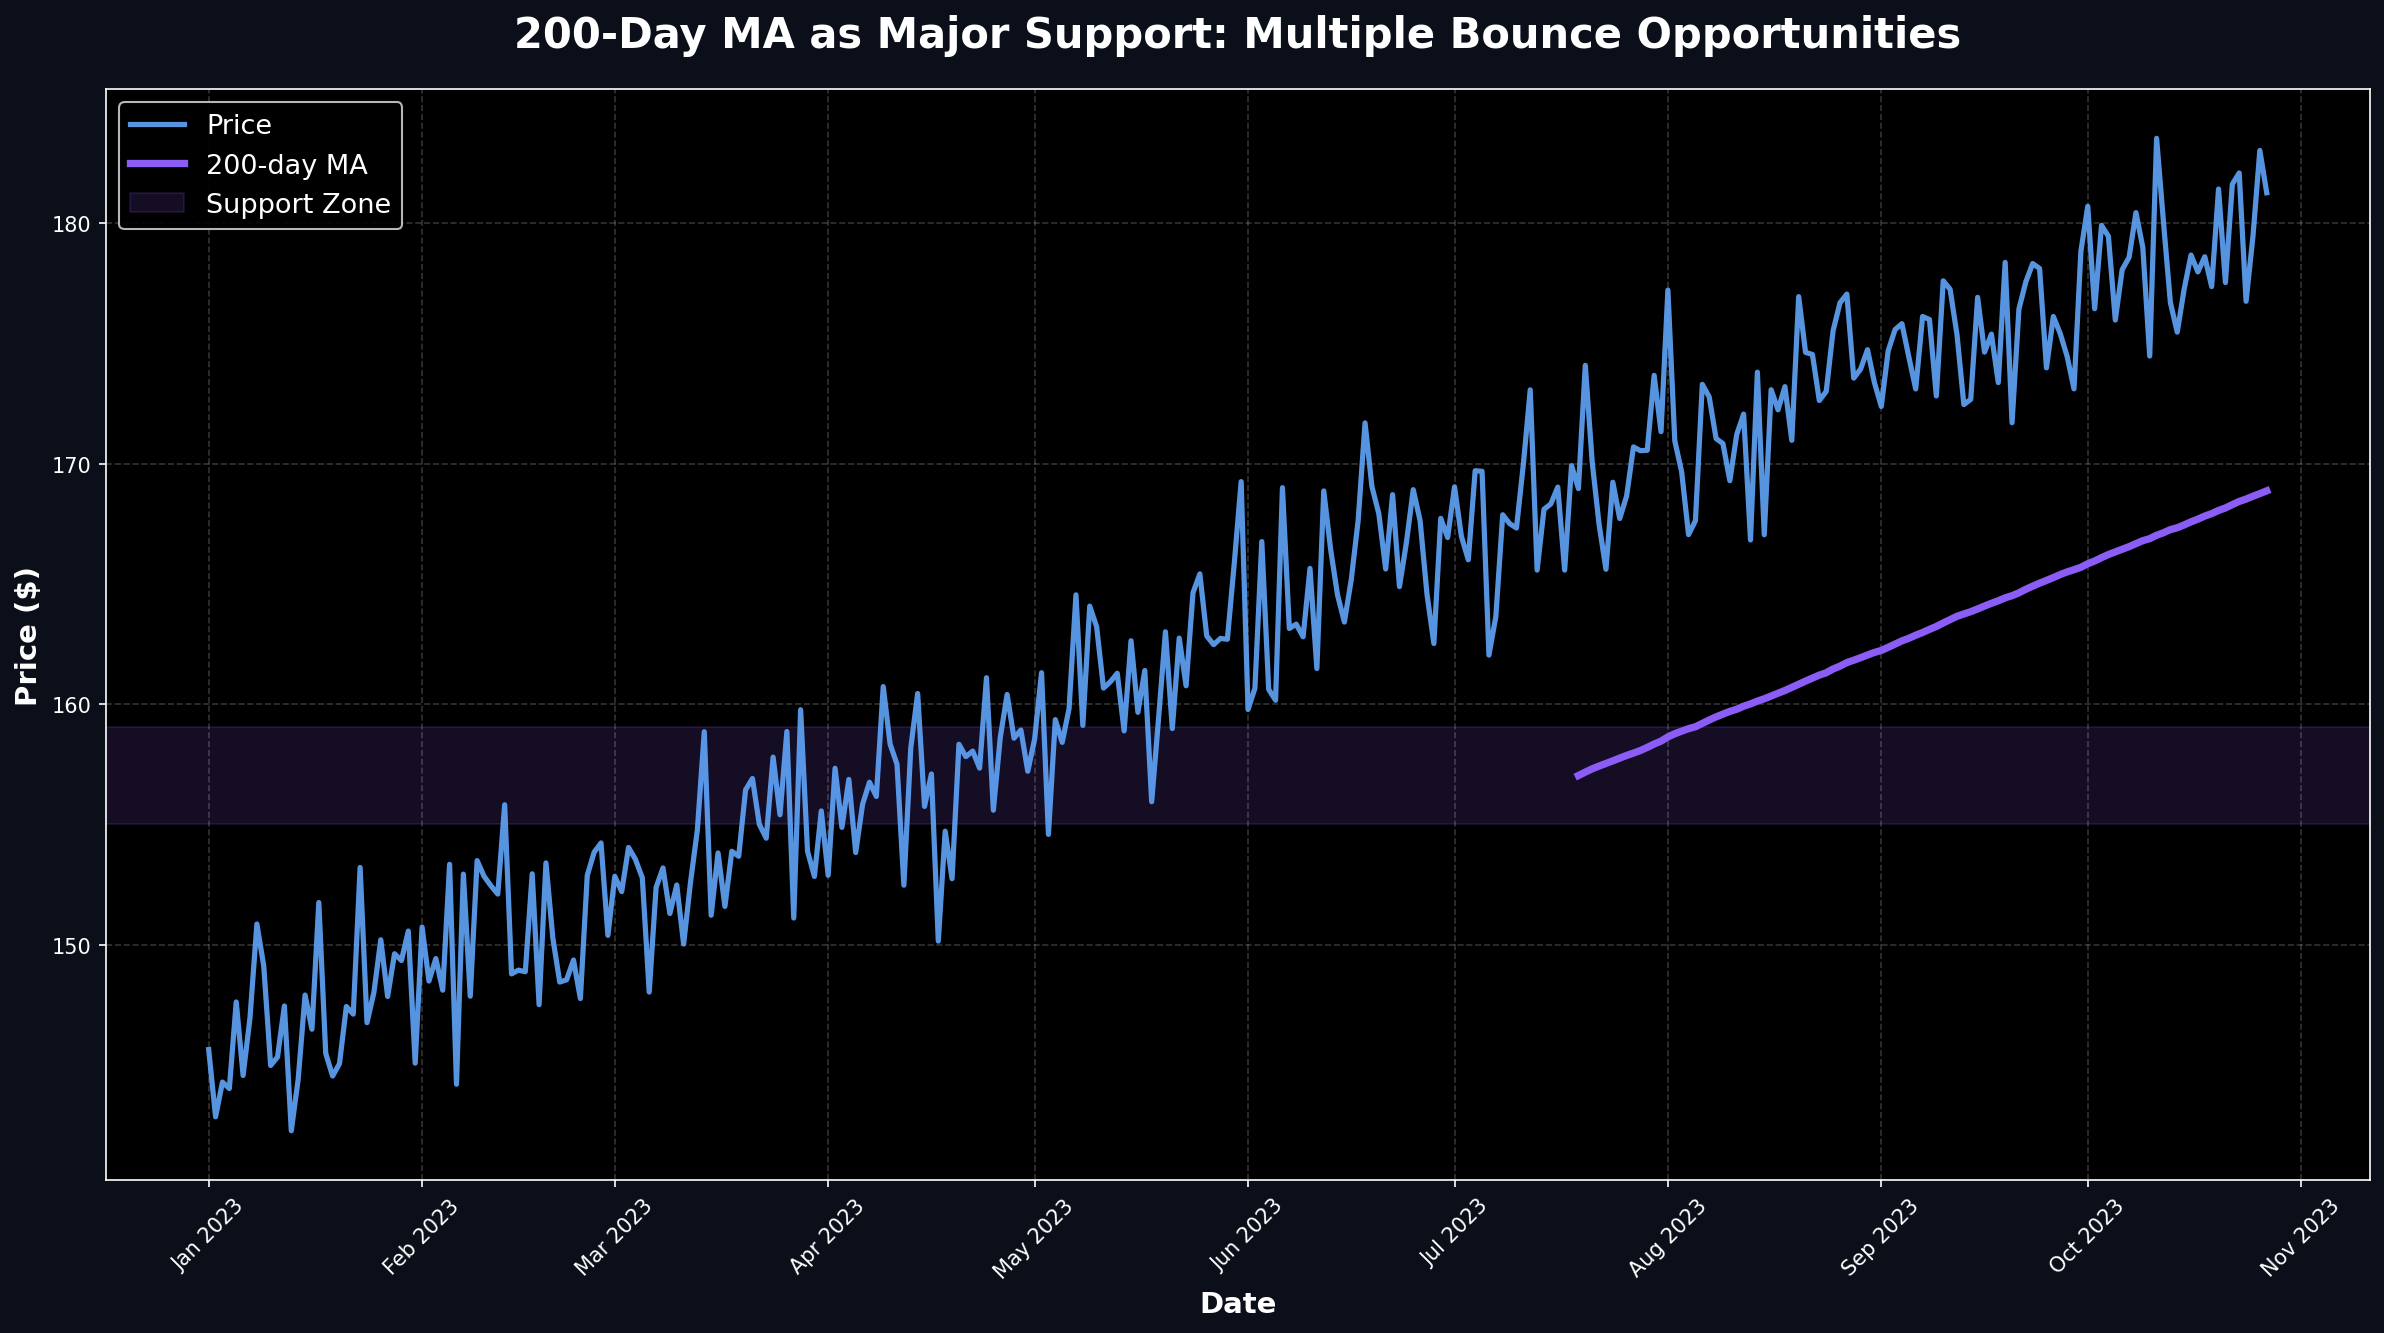
The 200 MA Bounce Strategy
One of the highest-probability setups in technical analysis is buying the first or second touch of the 200 MA in an established uptrend.
200 MA Bounce Setup:
- Prerequisite: Stock in clear uptrend (higher highs, higher lows)
- Signal: Price pulls back to 200 MA
- Confirmation: Bullish candle or volume spike at MA
- Entry: On close above 200 MA or next day's open
- Stop Loss: 2-3% below 200 MA
- Target: Previous high or 2:1 risk-reward
Real Example: AAPL 200 MA Bounces (2023)
Apple touched its 200 MA three times in 2023:
- January 2023: Bounced from $125 → rallied to $145 (+16%)
- May 2023: Tested $165 → rallied to $185 (+12%)
- October 2023: Touched $170 → rallied to $195 (+15%)
Each bounce offered a low-risk entry with clear stop placement. The 200 MA acted as a "line in the sand" for bulls.
⚠️ When 200 MA Bounces Fail
If price closes below the 200 MA with high volume, the trend may be reversing. Don't fight the tape—exit and wait for a new uptrend to establish.
The 50-Day Moving Average
The 50 MA is the sweet spot for swing traders. It's responsive enough to catch trends early but smooth enough to filter out noise.
Why 50 Days?
The 50-day period represents approximately 10 trading weeks or 2.5 months. It captures:
- Short-term trends: Swing moves lasting weeks to months
- Earnings momentum: Post-earnings price action
- Sector rotation: Industry group trends
- Swing trader timeframe: Perfect for 2-8 week holds
The 50 MA Pullback Strategy
In strong uptrends, stocks often pull back to the 50 MA before resuming their advance. This creates a repeatable trading pattern.
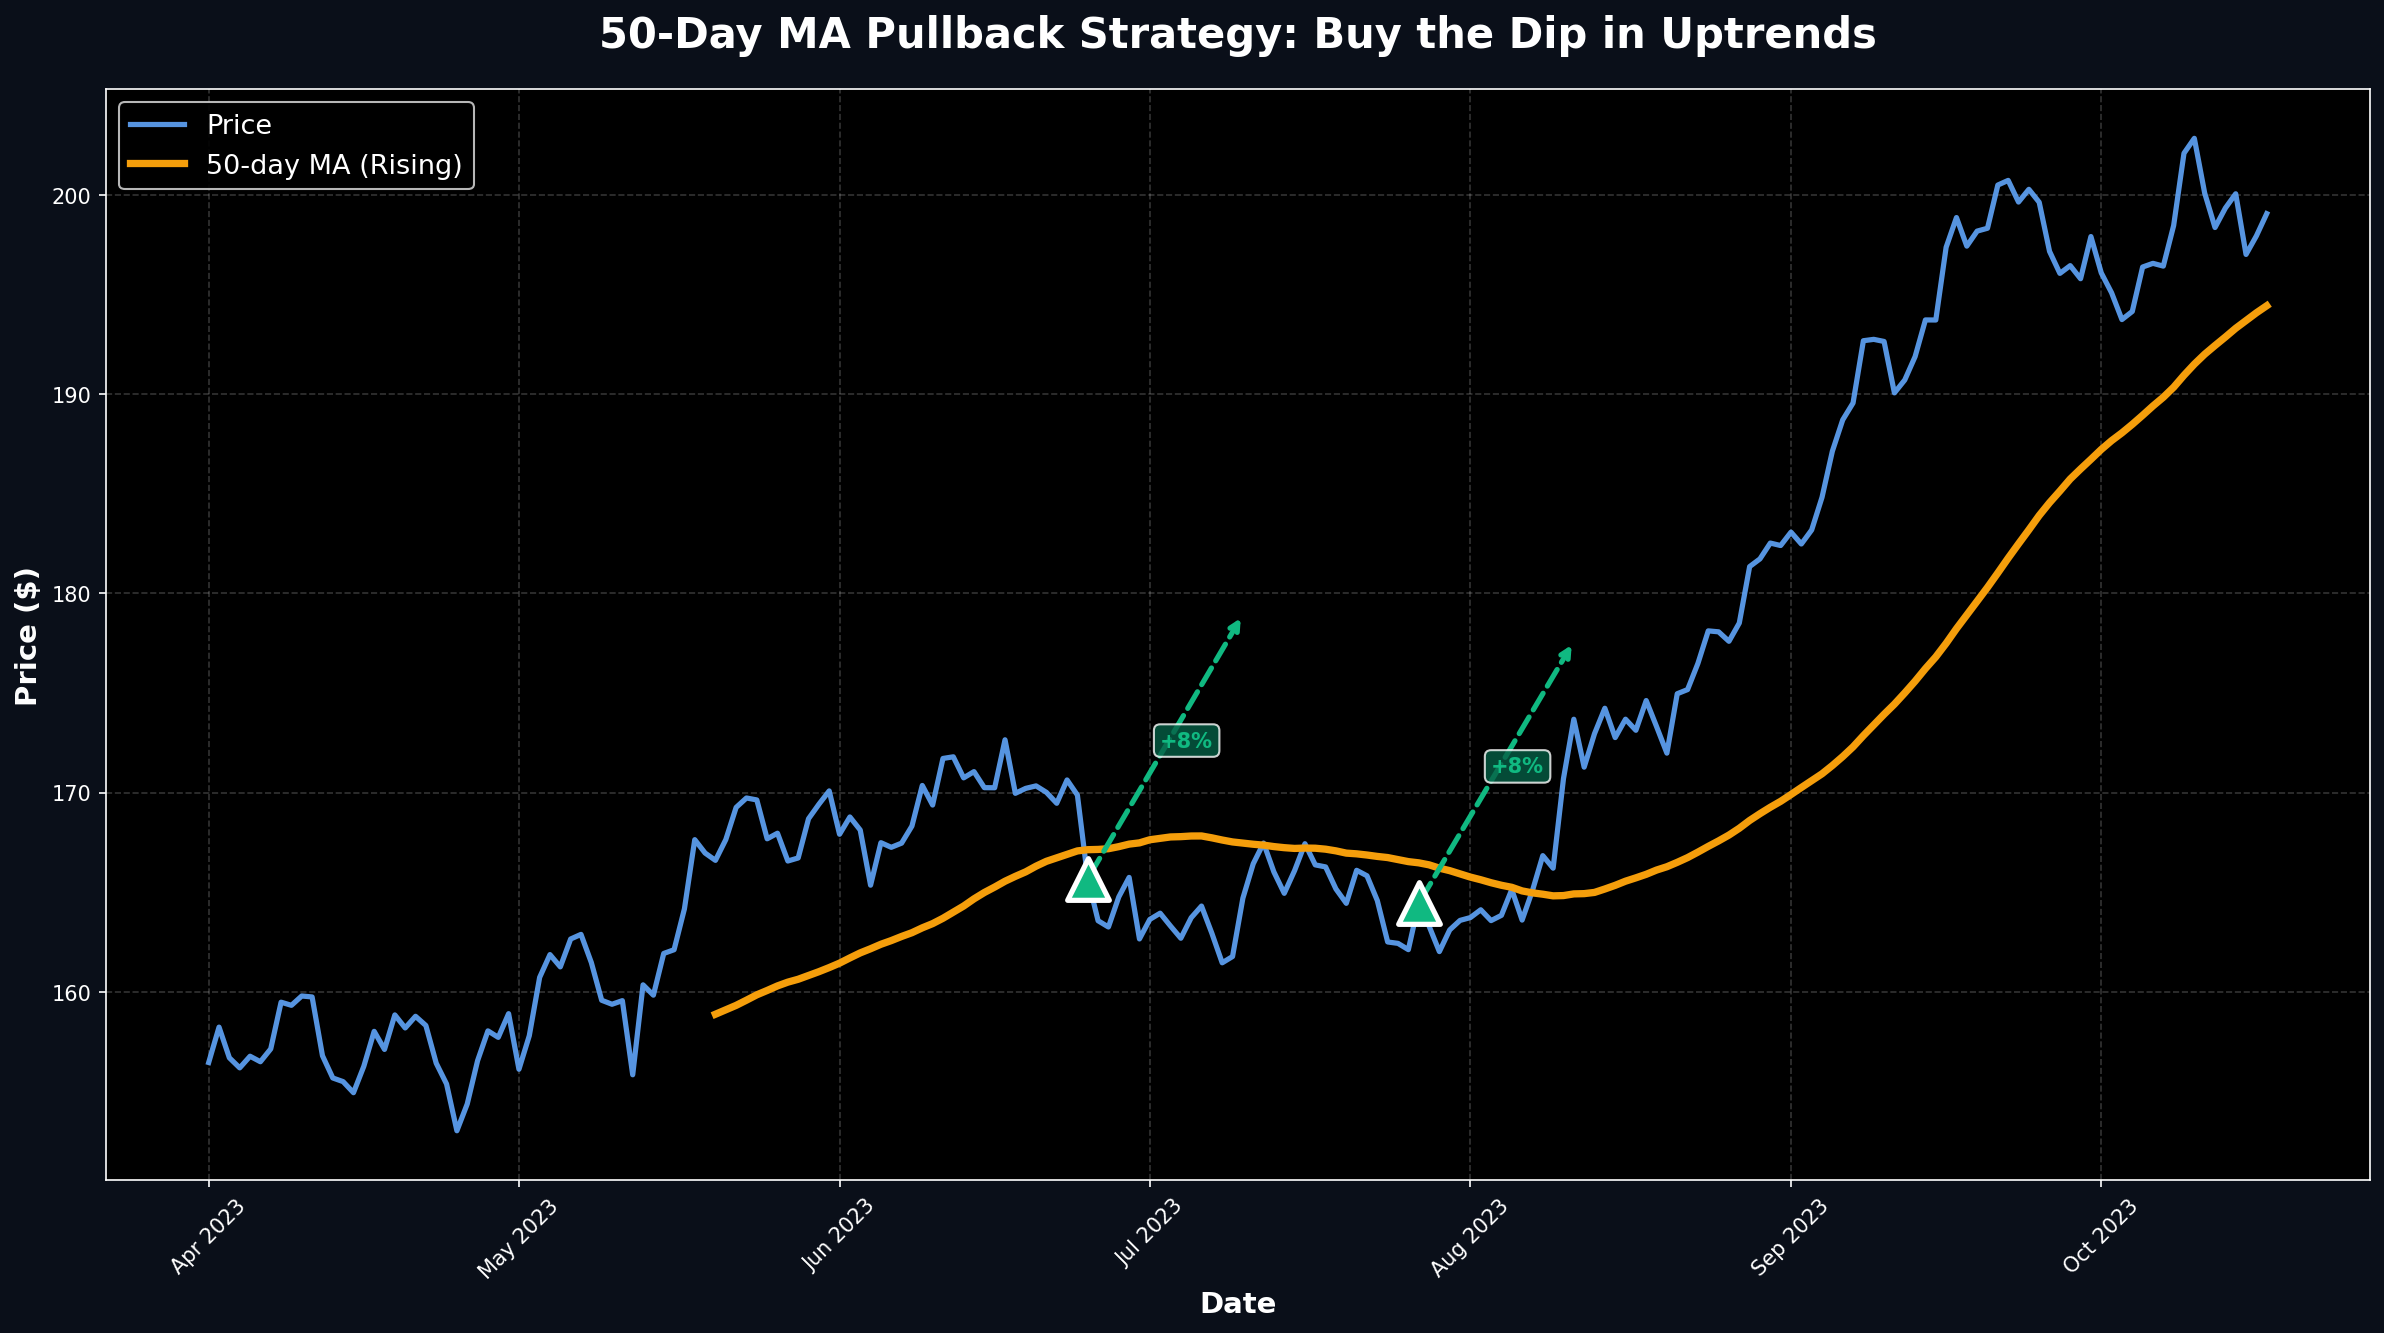
50 MA Pullback Setup:
- Prerequisite: Stock above both 50 MA and 200 MA
- Signal: Price pulls back to 50 MA after rally
- Confirmation: 50 MA is rising (not flat or falling)
- Entry: When price bounces off 50 MA with volume
- Stop Loss: Below 50 MA or recent swing low
- Target: Previous high or measured move
Real Example: NVDA 50 MA Pullbacks (2023)
NVIDIA's 2023 rally provided multiple 50 MA pullback opportunities:
- March 2023: Pulled to $240 50 MA → rallied to $320 (+33%)
- June 2023: Pulled to $380 50 MA → rallied to $480 (+26%)
- September 2023: Pulled to $420 50 MA → rallied to $500 (+19%)
Each pullback to the rising 50 MA offered a low-risk entry in a powerful uptrend.
Combining 50 MA and 200 MA
While this article focuses on single MA strategies, understanding the relationship between the 50 MA and 200 MA enhances your trading:
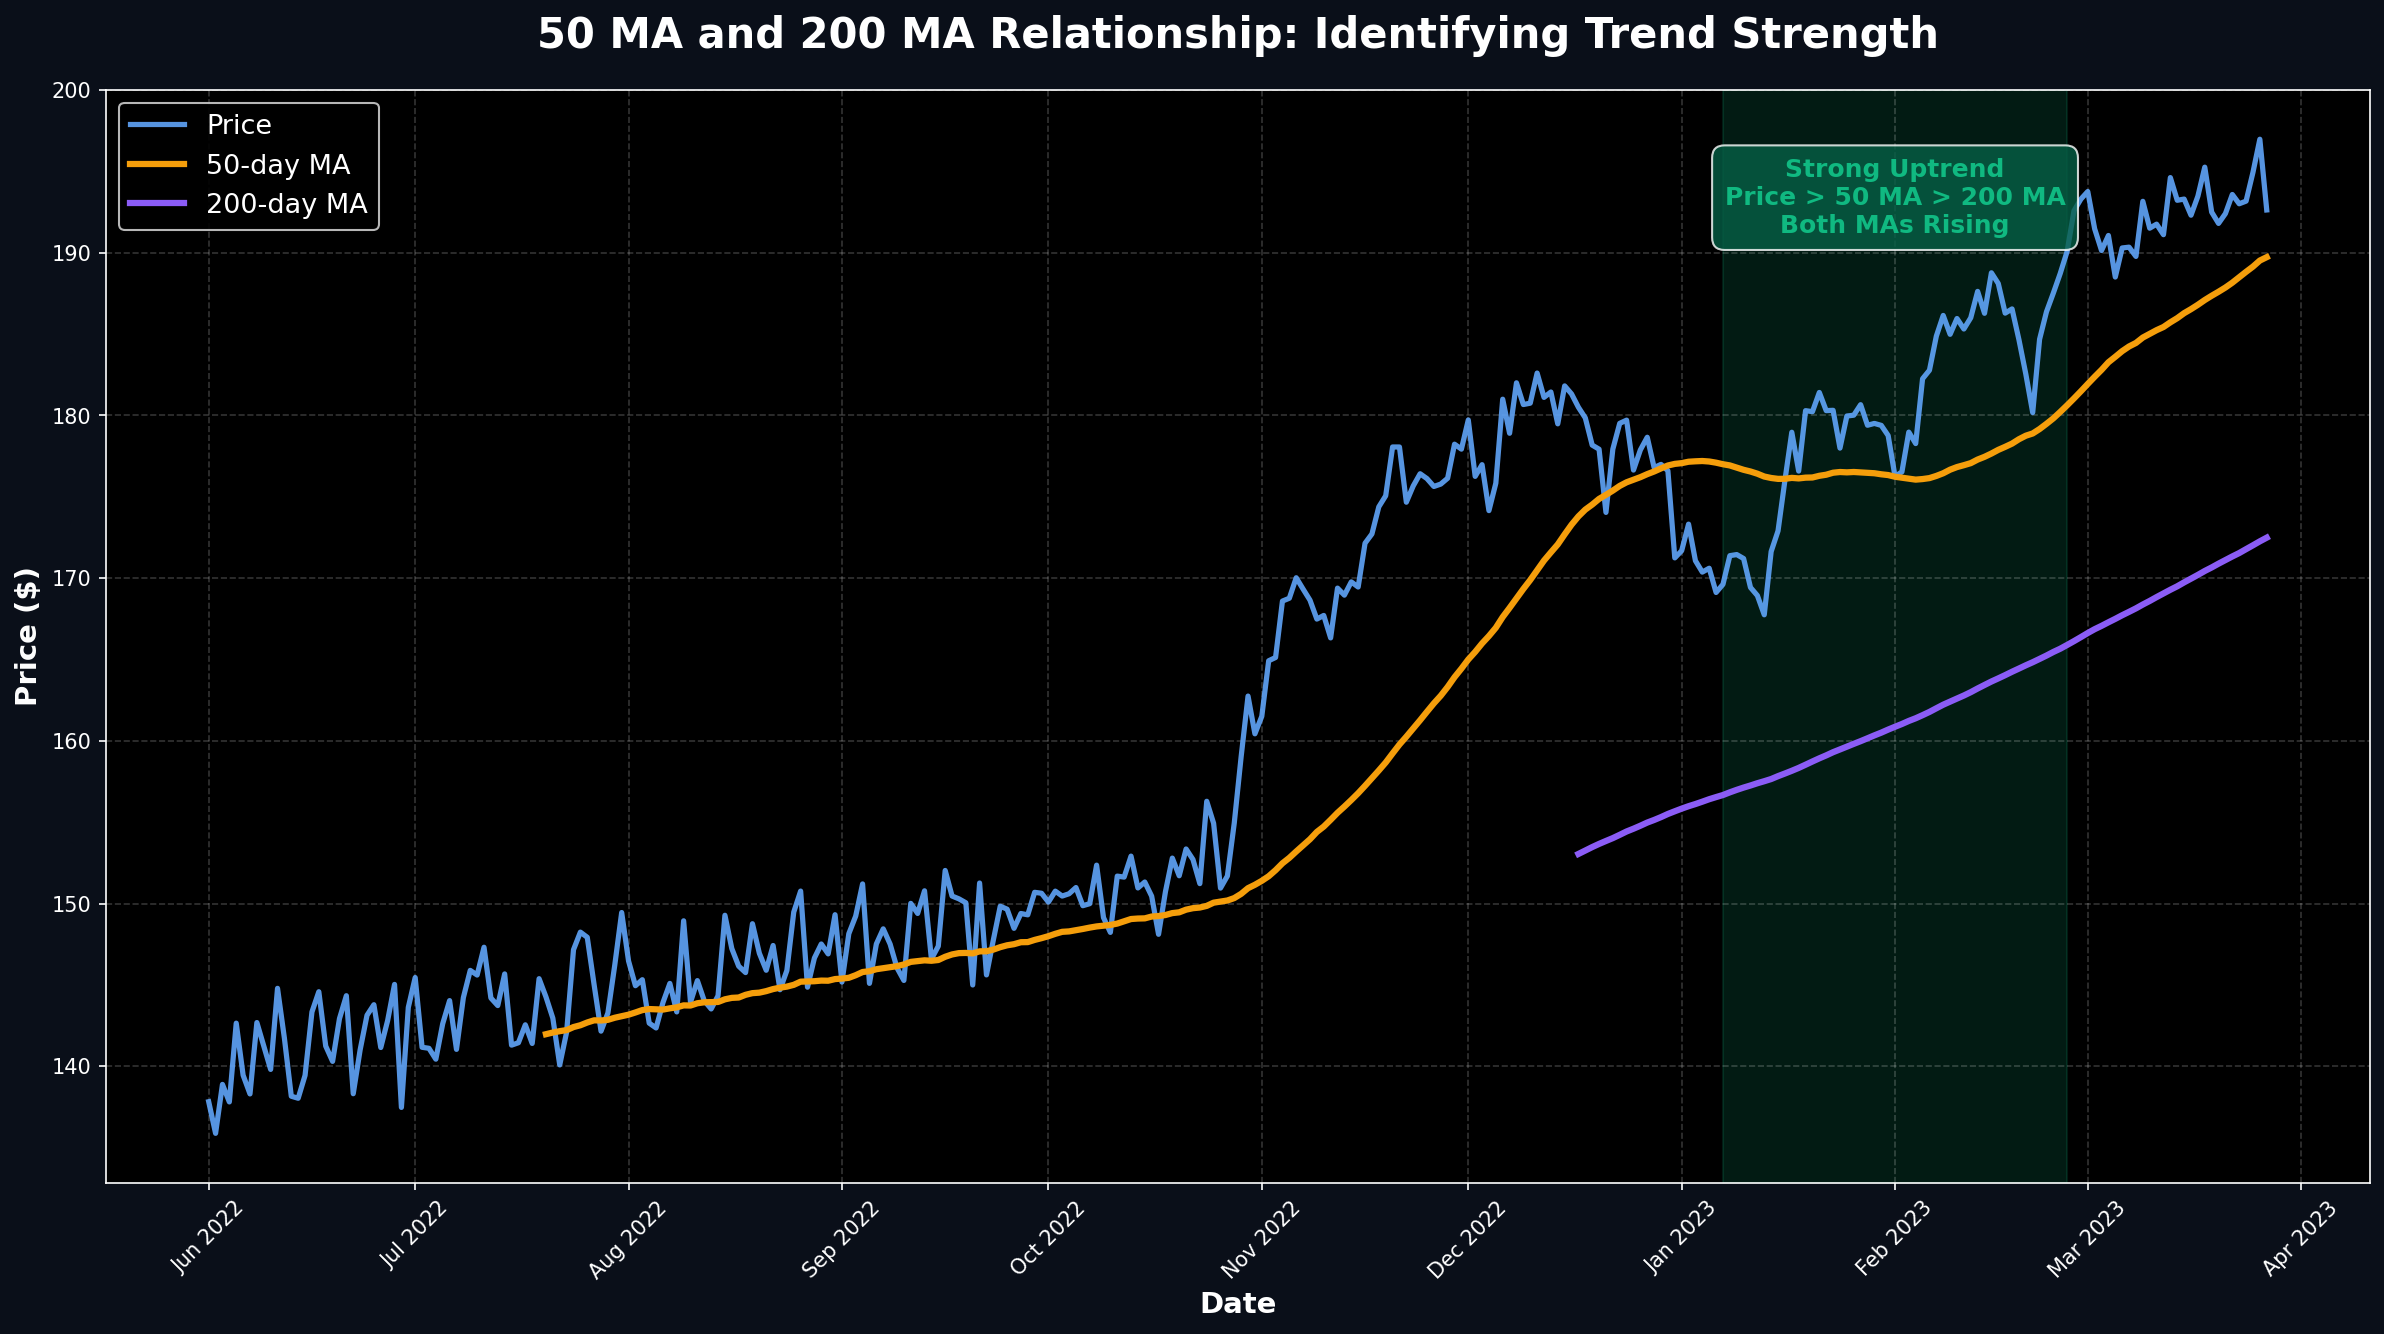
MA Relationship Guide:
- Both Rising, Price Above Both: Strong uptrend—buy pullbacks to 50 MA
- 50 MA Above 200 MA, Both Rising: Established uptrend—buy dips
- 50 MA Crosses Above 200 MA: Golden Cross—trend change signal
- Price Between 50 MA and 200 MA: Consolidation—wait for breakout
- 50 MA Crosses Below 200 MA: Death Cross—trend reversal warning
- Both Falling, Price Below Both: Strong downtrend—avoid longs
MA Slope Analysis
The slope (angle) of the MA is as important as price's position relative to it:
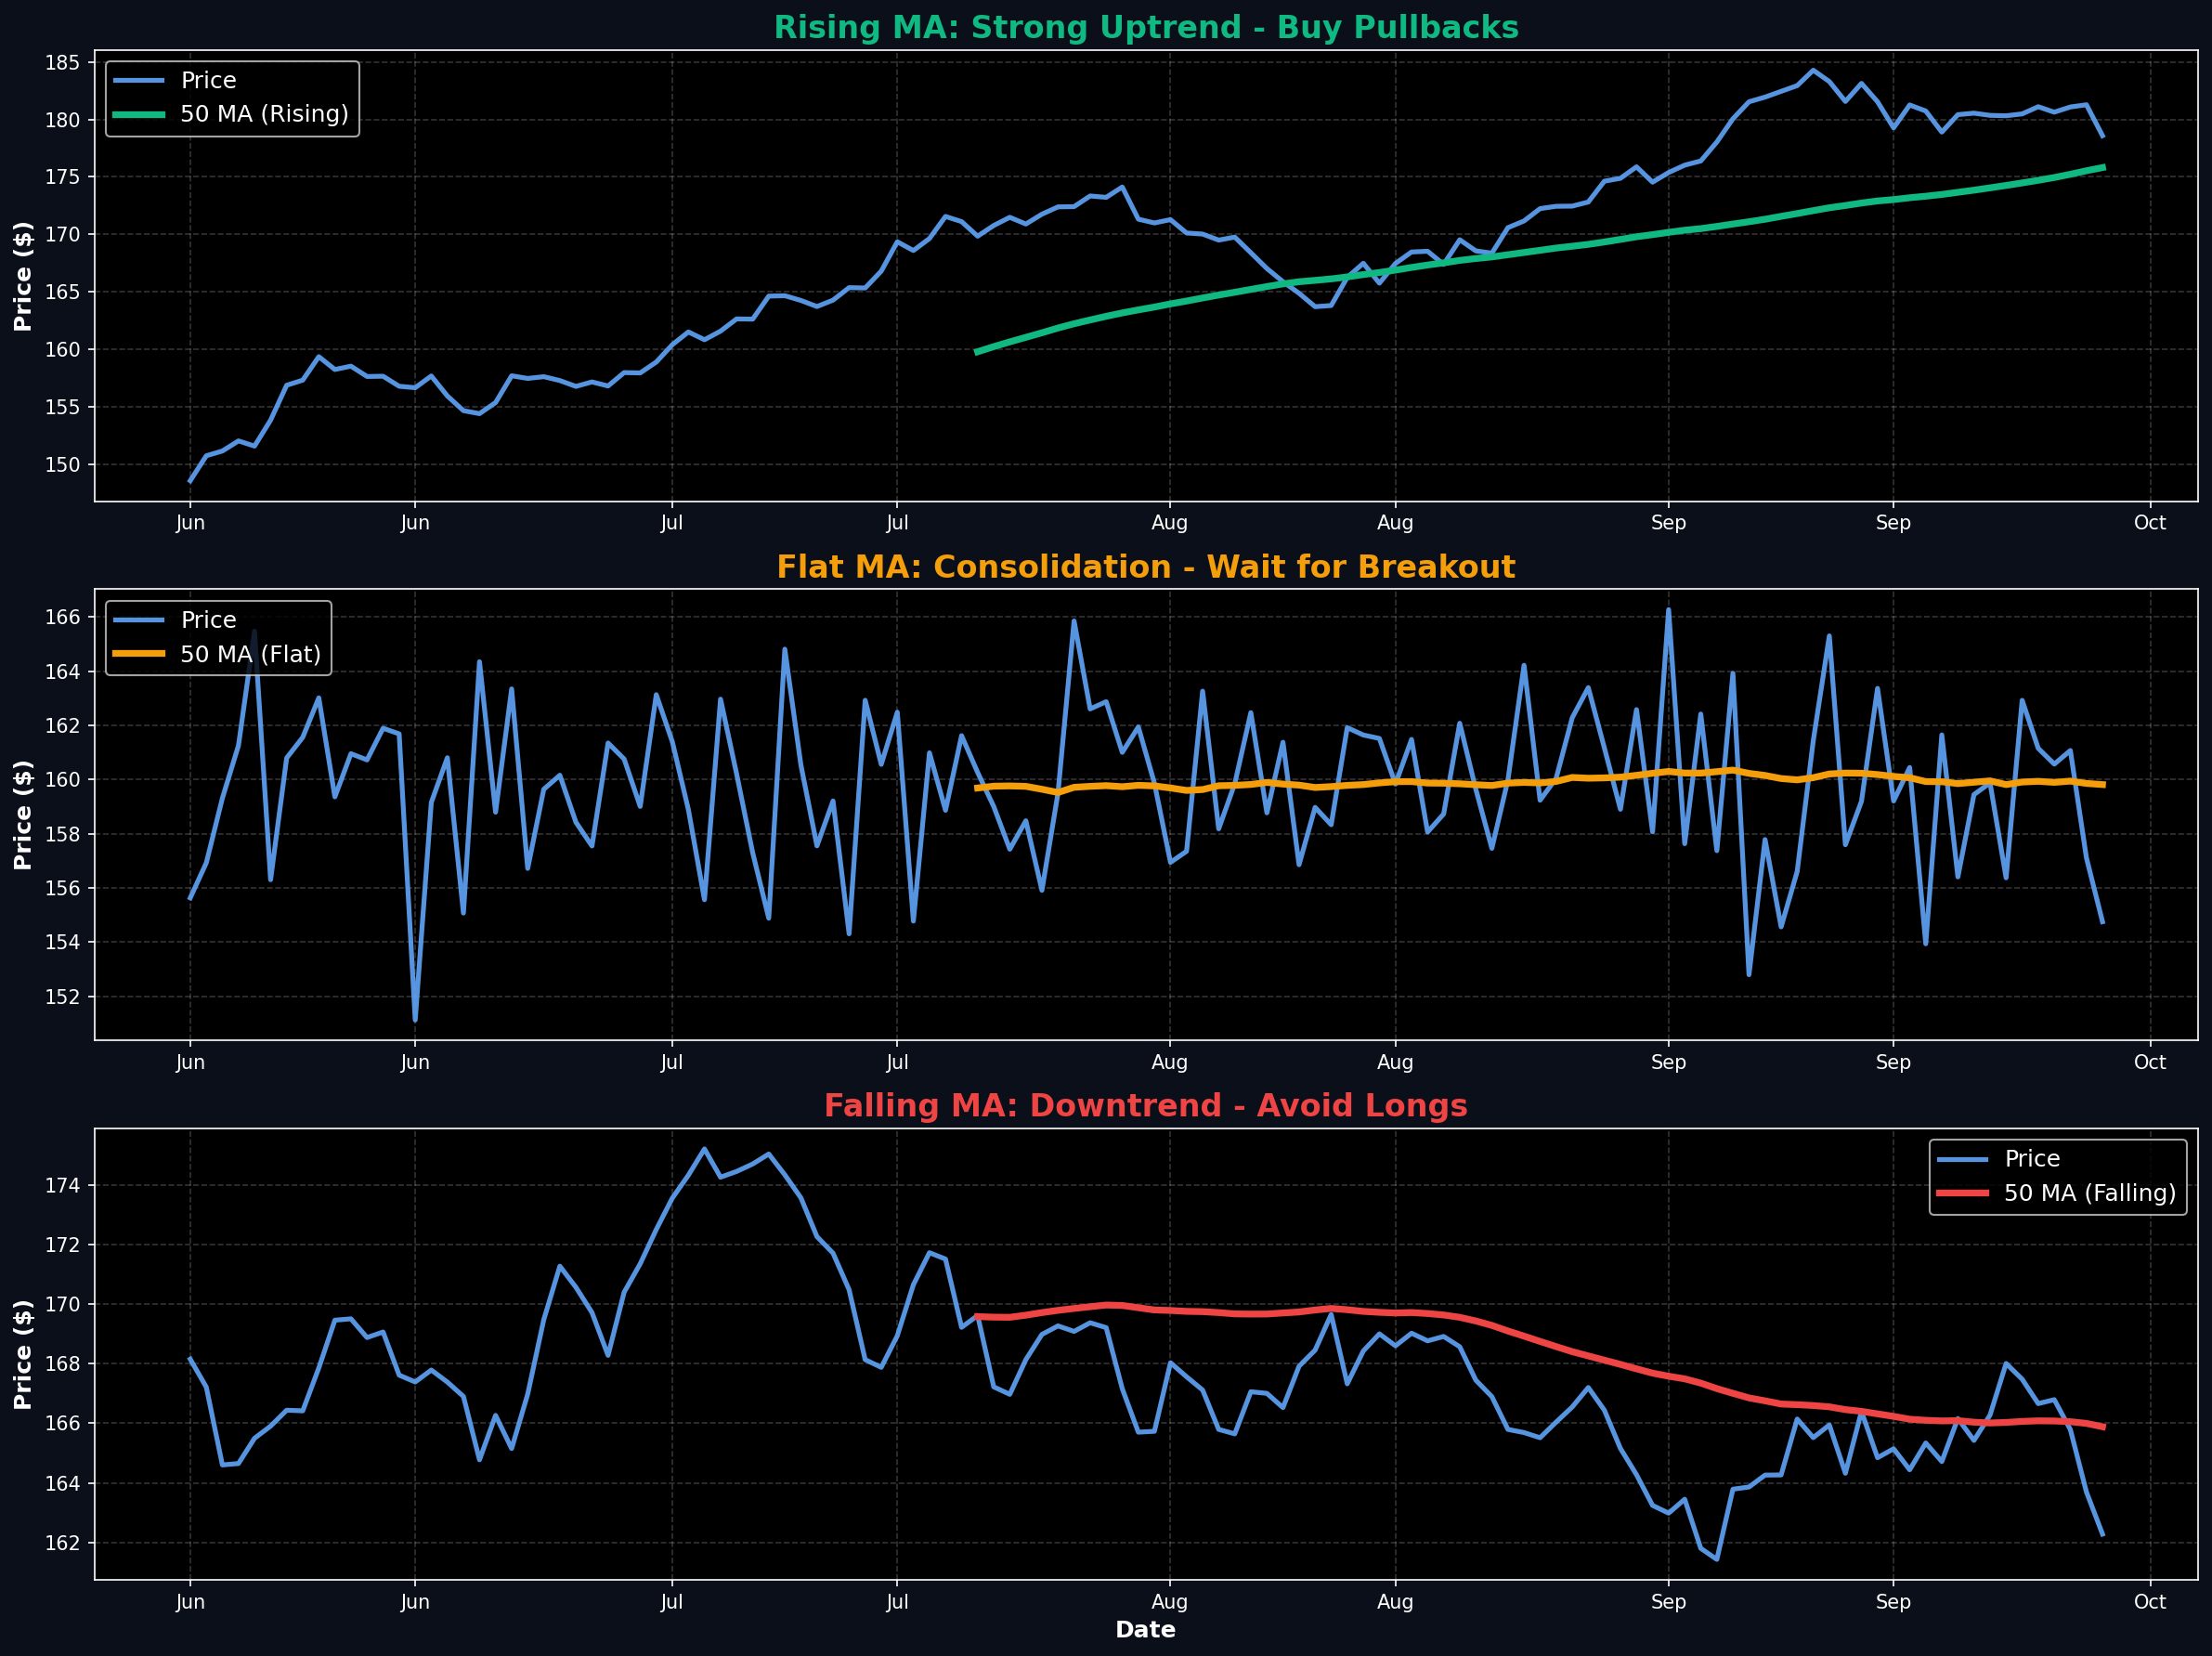
Rising MA (Bullish)
- Indicates increasing average price over time
- Supports bounce strategies
- Steeper slope = stronger trend
- Best for buying pullbacks
Flat MA (Neutral)
- Indicates consolidation or range-bound trading
- MA acts as pivot point
- Wait for slope to develop before trading
- Breakout from flat MA can be powerful
Falling MA (Bearish)
- Indicates decreasing average price
- MA acts as resistance on rallies
- Avoid buying until MA flattens or turns up
- Consider shorting rallies to MA
Advanced Single MA Techniques
1. The First Touch Rule
The first time a stock touches a key MA after a breakout often provides the best risk-reward. Subsequent touches have lower success rates as the trend matures.
2. Volume Confirmation
Bounces from MAs with above-average volume are more reliable. Low-volume bounces often fail.
Volume Rules:
- ✓ Volume spike on bounce = strong support
- ✓ Declining volume into MA = weak support
- ✓ High volume break below MA = trend change
3. Candlestick Confirmation
Look for bullish reversal patterns at MA support:
- Hammer: Long lower wick at MA shows rejection
- Bullish engulfing: Strong reversal signal
- Morning star: Multi-day reversal pattern
- Doji at MA: Indecision, wait for confirmation
4. Multiple Timeframe Analysis
Check the MA on higher timeframes for additional context:
- Daily 50 MA bounce + Weekly 20 MA support = high probability
- Daily 200 MA bounce + Weekly 50 MA support = very strong
- Conflicting signals between timeframes = wait for clarity
Risk Management for MA Trading
Single MA strategies require disciplined risk management:
Position Sizing Rules:
- Risk Per Trade: 1-2% of account
- Stop Distance: 2-5% below MA (adjust for volatility)
- Position Size: Account Risk ÷ Stop Distance
- Example: $100K account, 1% risk ($1K), 3% stop = $33K position
Stop Loss Placement:
- Initial Stop: 2-3% below MA or below recent swing low
- Trailing Stop: Move to breakeven after 1R gain
- Profit Protection: Trail stop below MA as price advances
- Exit Rule: Close below MA on high volume = exit immediately
Common Mistakes to Avoid
❌ Mistake #1: Buying Every MA Touch
Not all MA touches are equal. Only trade bounces when the MA is rising and the overall trend is intact. Avoid buying touches in downtrends.
❌ Mistake #2: No Stop Loss
MAs are not magic. They fail. Always use stops. A close below the MA with volume is your exit signal.
❌ Mistake #3: Ignoring the Trend
Don't try to catch falling knives. Wait for the MA to flatten and turn up before buying. Trend is your friend.
Backtesting Results
Studies of 50 MA and 200 MA bounce strategies on S&P 500 stocks (2010-2023):
50 MA Bounce Strategy:
- Win Rate: 68% (when MA is rising)
- Average Gain: +8.4% over 3-6 weeks
- Average Loss: -4.2% on failed bounces
- Best Conditions: Strong uptrend, first or second touch
200 MA Bounce Strategy:
- Win Rate: 72% (when MA is rising)
- Average Gain: +12.6% over 2-4 months
- Average Loss: -6.1% on failed bounces
- Best Conditions: Established uptrend, high volume bounce
Practical Trading Plan
Here's a complete single MA trading system you can implement today:
50 MA Swing Trading System:
- Scan: Stocks above 50 MA and 200 MA, both rising
- Watch: Wait for pullback to 50 MA
- Entry: Buy when price bounces off 50 MA with volume
- Stop: 3% below 50 MA or below recent swing low
- Target 1: Previous high (take 50% profit)
- Target 2: Trail stop at 50 MA (let 50% run)
- Exit: Close below 50 MA on high volume
Key Takeaways
- ✓ 200 MA is the most important single indicator—separates bulls from bears
- ✓ 50 MA is perfect for swing trading—responsive but smooth
- ✓ Buy bounces when MA is rising—avoid falling MAs
- ✓ First touch has best odds—subsequent touches weaken
- ✓ Volume confirms bounces—low volume bounces often fail
- ✓ MA slope matters—rising = bullish, falling = bearish
- ✓ Always use stops—close below MA = exit
- ✓ Combine with price action—candlestick patterns add confirmation
Next Steps
Ready to trade single MA strategies? Start by:
- 1. Scanning for stocks above rising 50 MA and 200 MA
- 2. Paper trading 50 MA bounces for 20 trades
- 3. Tracking your results and refining entry timing
- 4. Graduating to live trading with small position sizes
📚 Continue Learning
Explore our other moving average guides:
Ready to Put This Into Practice?
Join MarketDly to access real-time market insights, AI-powered analysis, and professional trading tools.
No credit card required • Free tier available • Upgrade anytime