Moving Averages Basics: Complete Guide to SMA and EMA
Moving averages are the most widely used technical indicator in trading. Master the fundamentals of Simple Moving Averages (SMA) and Exponential Moving Averages (EMA) to identify trends, find support and resistance, and time your entries.
What is a Moving Average?
A moving average (MA) is a trend-following indicator that smooths out price data by calculating the average price over a specific period. As new prices come in, the oldest prices drop off, creating a "moving" average that follows the trend.
Key Purpose: Moving averages filter out market noise and help identify the direction and strength of a trend. They're the foundation of countless trading strategies.
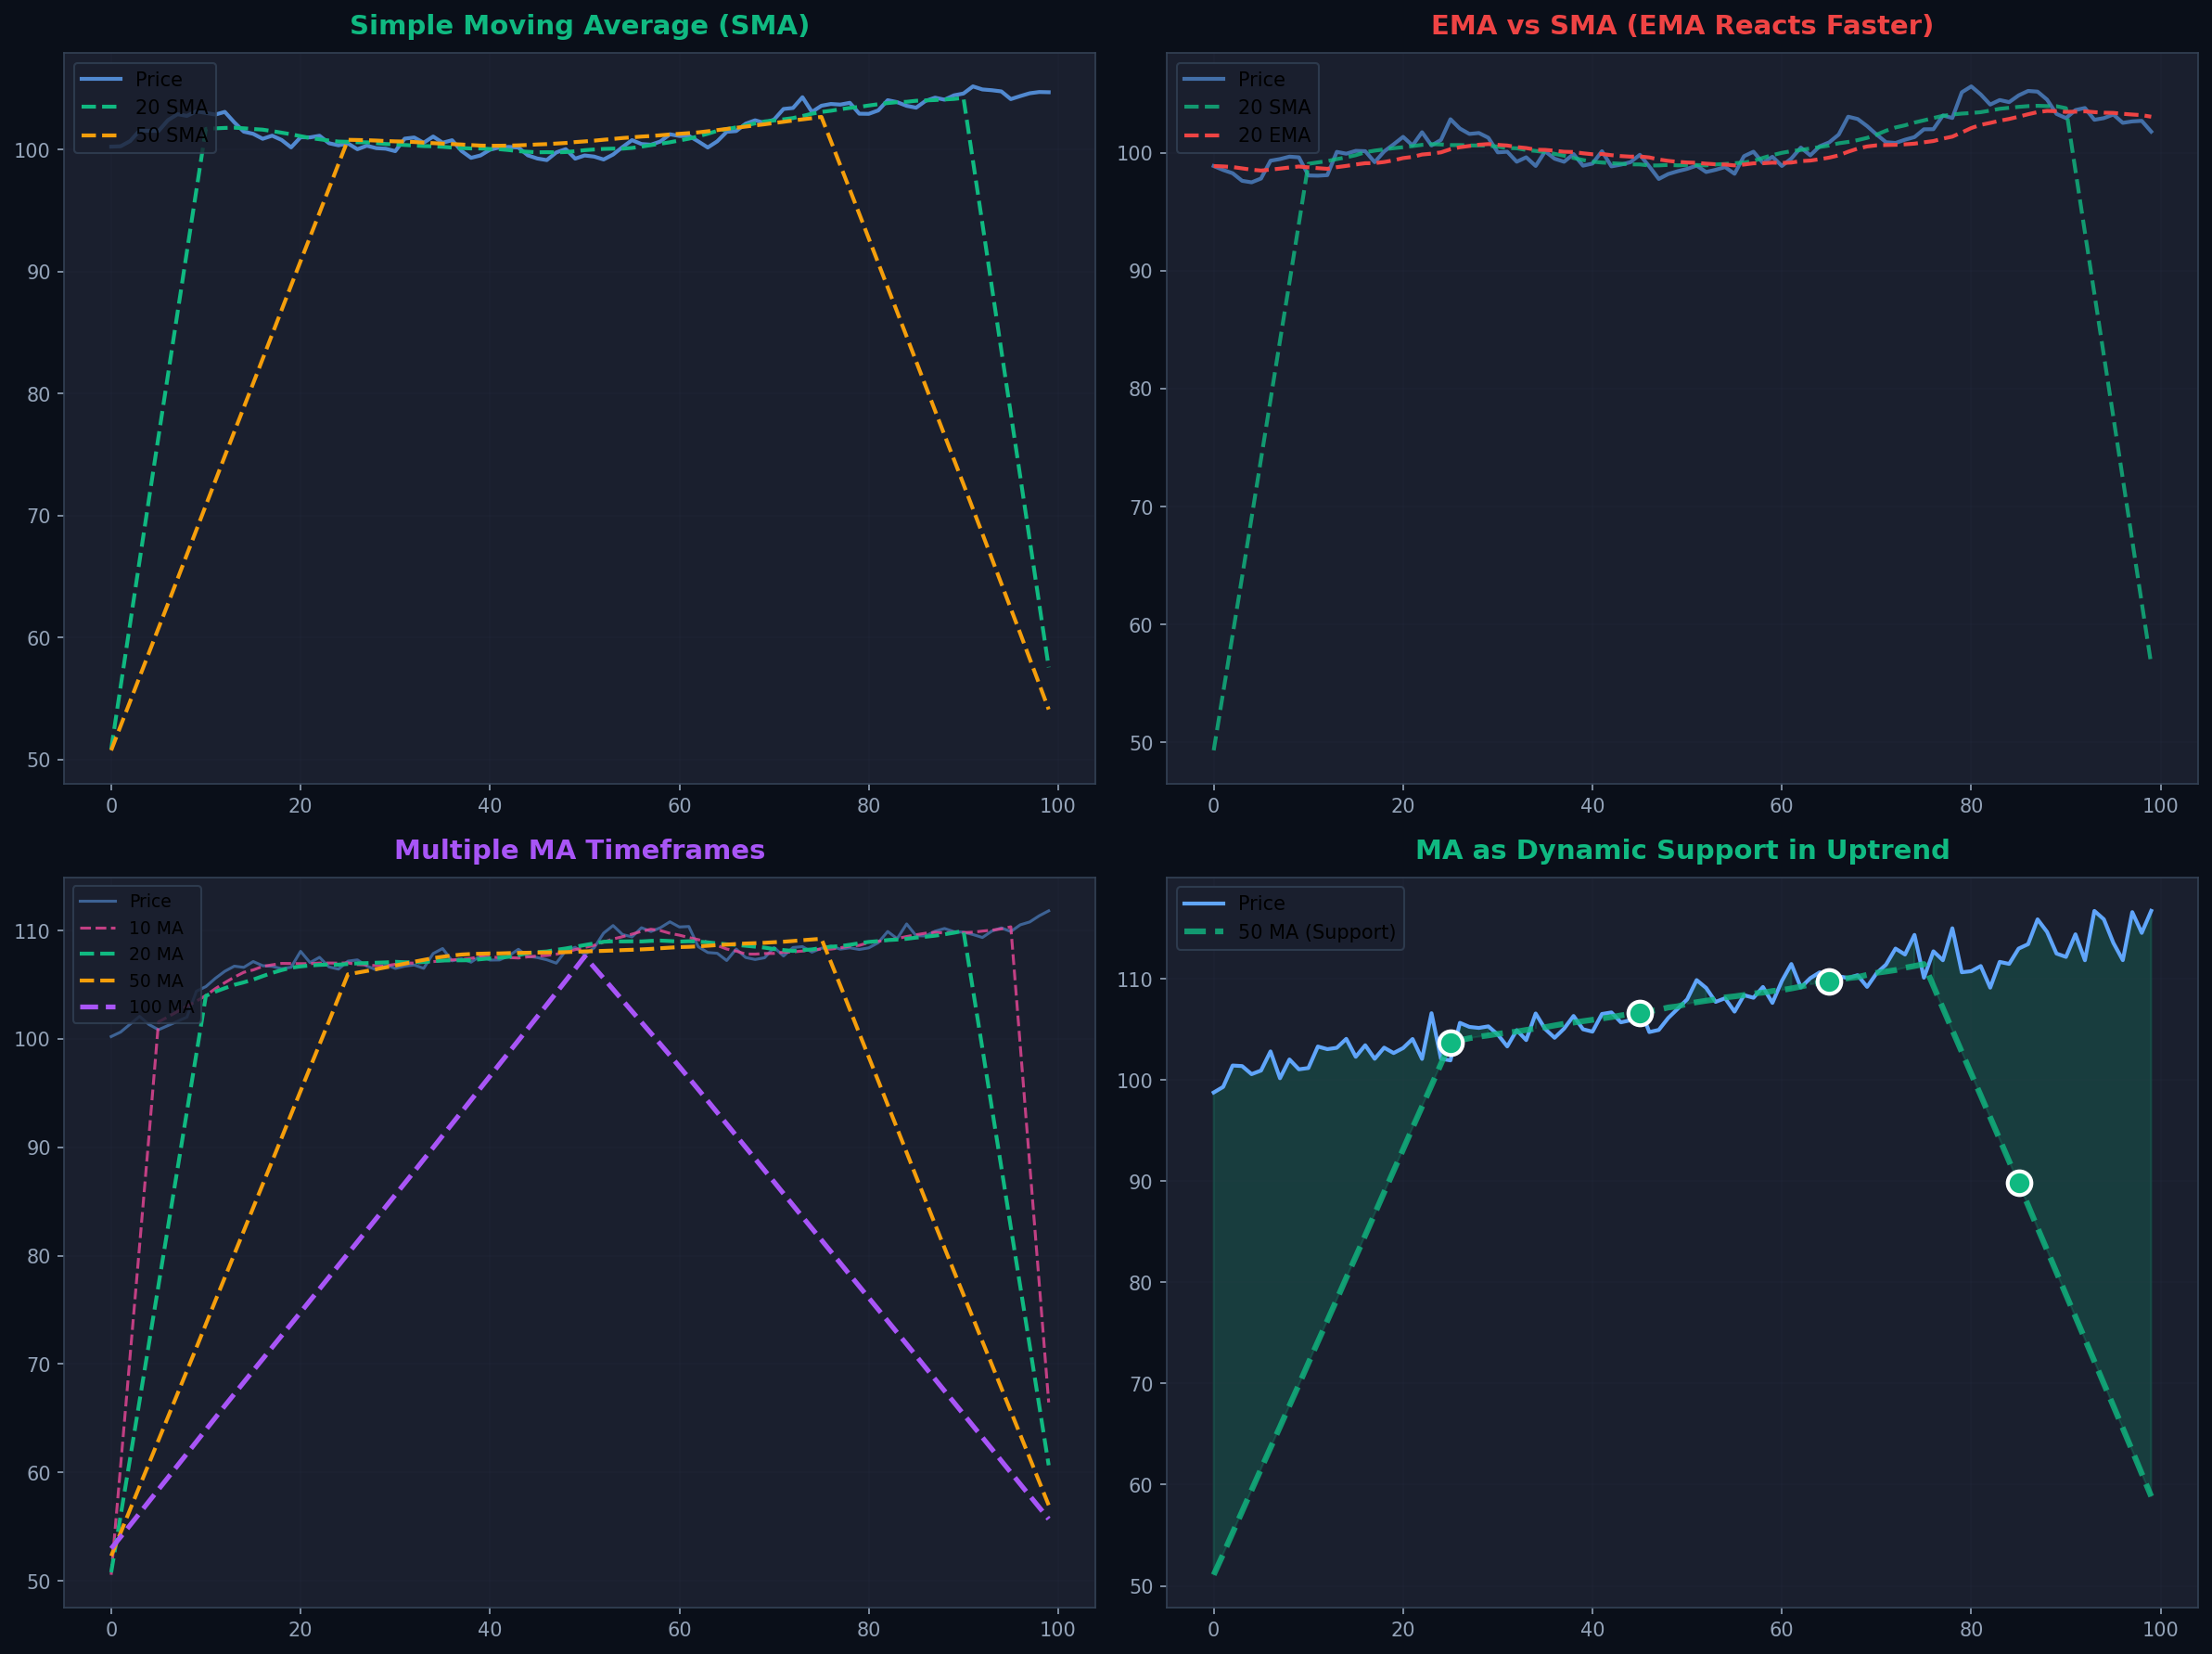
Simple Moving Average (SMA)
The Simple Moving Average is the most basic form. It calculates the arithmetic mean of prices over a specified period.
SMA Calculation
SMA = (P₁ + P₂ + P₃ + ... + Pₙ) / n
Where P = Price, n = Number of periods
Example 5-day SMA:
Day 1: $100, Day 2: $102, Day 3: $101, Day 4: $103, Day 5: $104
SMA = (100 + 102 + 101 + 103 + 104) / 5 = $102
SMA Characteristics
- Equal weighting: All prices in the period have equal importance
- Smooth: Less reactive to recent price changes
- Lagging: Slower to respond to new trends
- Reliable: Less prone to false signals in choppy markets
- Popular periods: 20, 50, 100, 200 days
Exponential Moving Average (EMA)
The Exponential Moving Average gives more weight to recent prices, making it more responsive to new information.
EMA Calculation
EMA = (Price × Multiplier) + (Previous EMA × (1 - Multiplier))
Multiplier = 2 / (Period + 1)
For 20-period EMA:
Multiplier = 2 / (20 + 1) = 0.0952 (9.52%)
Recent price gets 9.52% weight, previous EMA gets 90.48%
EMA Characteristics
- Weighted: Recent prices have more influence
- Responsive: Reacts faster to price changes
- Leading: Catches trends earlier than SMA
- Sensitive: More prone to false signals
- Popular periods: 8, 12, 20, 50 days
SMA vs EMA: Which to Use?
| Aspect | SMA | EMA |
|---|---|---|
| Calculation | Simple average | Weighted average |
| Responsiveness | Slower | Faster |
| Lag | More lag | Less lag |
| False Signals | Fewer | More |
| Best For | Long-term trends, swing trading | Short-term trends, day trading |
| Smoothness | Smoother | More volatile |
General Rule: Use SMA for longer timeframes and swing trading. Use EMA for shorter timeframes and day trading. Many traders use both together.
Popular Moving Average Periods
Short-Term MAs (5-20 periods)
- 5 MA: Very short-term, scalping, high noise
- 8 MA: Day trading, quick trend changes
- 10 MA: Short-term momentum, swing entries
- 20 MA: Most popular short-term MA, daily trading
Medium-Term MAs (21-100 periods)
- 50 MA: Intermediate trend, widely watched support/resistance
- 100 MA: Medium-term trend confirmation
Long-Term MAs (100+ periods)
- 200 MA: THE most important MA - major support/resistance, bull/bear market divider
- Weekly/Monthly MAs: For long-term investors
The 200-Day MA: This is the single most watched moving average in the market. Price above 200 MA = bull market. Price below 200 MA = bear market. Institutional traders pay close attention to this level.
How Moving Averages Identify Trends
Trend Direction
- Uptrend: Price above MA, MA sloping upward
- Downtrend: Price below MA, MA sloping downward
- Sideways: Price crossing MA frequently, MA flat
Trend Strength
- Strong trend: Price stays far from MA, MA has steep slope
- Weak trend: Price hugs MA, MA has gentle slope
- Trend exhaustion: Price moves far from MA (overextended)
Moving Averages as Support and Resistance
One of the most powerful uses of MAs is as dynamic support and resistance levels.
In Uptrends
- Price pulls back to MA and bounces (MA acts as support)
- 20 MA provides short-term support
- 50 MA provides intermediate support
- 200 MA provides major long-term support
In Downtrends
- Price rallies to MA and reverses (MA acts as resistance)
- Failed breakouts above MA confirm downtrend
- Breaking above MA signals potential trend change
Basic Trading Strategies
Strategy 1: MA Bounce (Pullback Trading)
- Setup: Strong uptrend, price above 50 MA
- Entry: Price pulls back to 20 or 50 MA and bounces
- Confirmation: Bullish candle at MA, volume increase
- Stop Loss: Below the MA
- Target: Previous high or 2:1 risk-reward
Strategy 2: MA Crossover
- Bullish Signal: Price crosses above MA from below
- Bearish Signal: Price crosses below MA from above
- Best with: 50 MA or 200 MA for major signals
- Confirmation: Strong momentum candle, volume
Strategy 3: MA Slope Trading
- Buy: When MA starts sloping upward after being flat/down
- Sell: When MA starts sloping downward after being flat/up
- Best for: Catching early trend changes
Common Mistakes to Avoid
❌ Using MAs in Choppy Markets
MAs work best in trending markets. In sideways/choppy markets, you'll get constant false signals as price whipsaws across the MA.
❌ Using Too Many MAs
Don't clutter your chart with 5+ moving averages. Stick to 2-3 key MAs (e.g., 20, 50, 200) for clarity.
❌ Ignoring Price Action
MAs are lagging indicators. Always confirm with price action, candlestick patterns, and volume before trading.
❌ Wrong Timeframe
Using a 200 MA on a 5-minute chart is meaningless. Match your MA period to your trading timeframe.
❌ Expecting Perfect Bounces
Price doesn't always touch the MA exactly. Allow for 1-2% variance and look for the zone around the MA.
Timeframe Considerations
| Trading Style | Chart Timeframe | Recommended MAs |
|---|---|---|
| Scalping | 1-min, 5-min | 5 EMA, 8 EMA, 20 EMA |
| Day Trading | 5-min, 15-min, 1-hour | 9 EMA, 20 EMA, 50 SMA |
| Swing Trading | Daily | 20 SMA, 50 SMA, 200 SMA |
| Position Trading | Daily, Weekly | 50 SMA, 100 SMA, 200 SMA |
| Long-Term Investing | Weekly, Monthly | 50 SMA, 200 SMA |
Combining MAs with Other Indicators
Moving averages work best when combined with other technical tools:
- MA + Support/Resistance: When MA aligns with horizontal S/R, it's a powerful level
- MA + Volume: High volume at MA bounce confirms strength
- MA + Candlestick Patterns: Hammer at 50 MA = high-probability long
- MA + RSI: Oversold RSI + MA bounce = strong buy signal
- MA + MACD: MACD crossover + price above 200 MA = trend confirmation
Advanced Concepts
MA Confluence
When multiple MAs cluster together (e.g., 20, 50, and 200 MA all within 2-3%), it creates a powerful support or resistance zone. Breakouts from these zones often lead to strong moves.
MA Ribbon
Using multiple MAs (e.g., 10, 20, 30, 40, 50) creates a "ribbon" effect. When the ribbon expands, trend is strong. When it contracts, trend is weakening or reversing.
MA Displacement
Shifting the MA forward or backward in time can help predict future support/resistance levels or reduce lag. Advanced technique used by professional traders.
Key Takeaways
- ✅ Moving averages smooth price data and identify trends
- ✅ SMA = simple average, EMA = weighted toward recent prices
- ✅ Use SMA for long-term, EMA for short-term trading
- ✅ 20, 50, and 200 are the most important MA periods
- ✅ MAs act as dynamic support in uptrends, resistance in downtrends
- ✅ Price above MA = bullish, below MA = bearish
- ✅ MAs work best in trending markets, poorly in choppy markets
- ✅ Always confirm MA signals with price action and volume
- ✅ Combine MAs with other indicators for higher probability setups
- ✅ The 200 MA is the most watched level by institutions
Next Steps
Now that you understand moving average basics, you can explore more advanced strategies like MA crossovers (Golden Cross, Death Cross), multiple MA systems, and combining MAs with other technical indicators for complete trading systems.
Practice identifying trends using the 20, 50, and 200 MAs on your charts. Watch how price interacts with these levels and start recognizing high-probability bounce setups.
Related Articles
Ready to Put This Into Practice?
Join MarketDly to access real-time market insights, AI-powered analysis, and professional trading tools.
No credit card required • Free tier available • Upgrade anytime