Dynamic Support and Resistance: Moving Averages and Trendlines
Unlike static horizontal levels, dynamic support and resistance move with price. Master moving averages and trendlines to identify support and resistance in trending markets.
What is Dynamic Support and Resistance?
Dynamic S&R levels move with price action. They're particularly useful in trending markets where static horizontal levels become less relevant. The two main types are moving averages and trendlines.
Moving Averages as S&R
Most Effective Moving Averages
| Moving Average | Best For | Strength |
|---|---|---|
| 20 EMA | Day trading, short-term swings | Moderate |
| 50 SMA/EMA | Swing trading, intermediate trends | Strong |
| 100 SMA | Position trading | Very Strong |
| 200 SMA/EMA | Long-term trends, major levels | Extremely Strong |
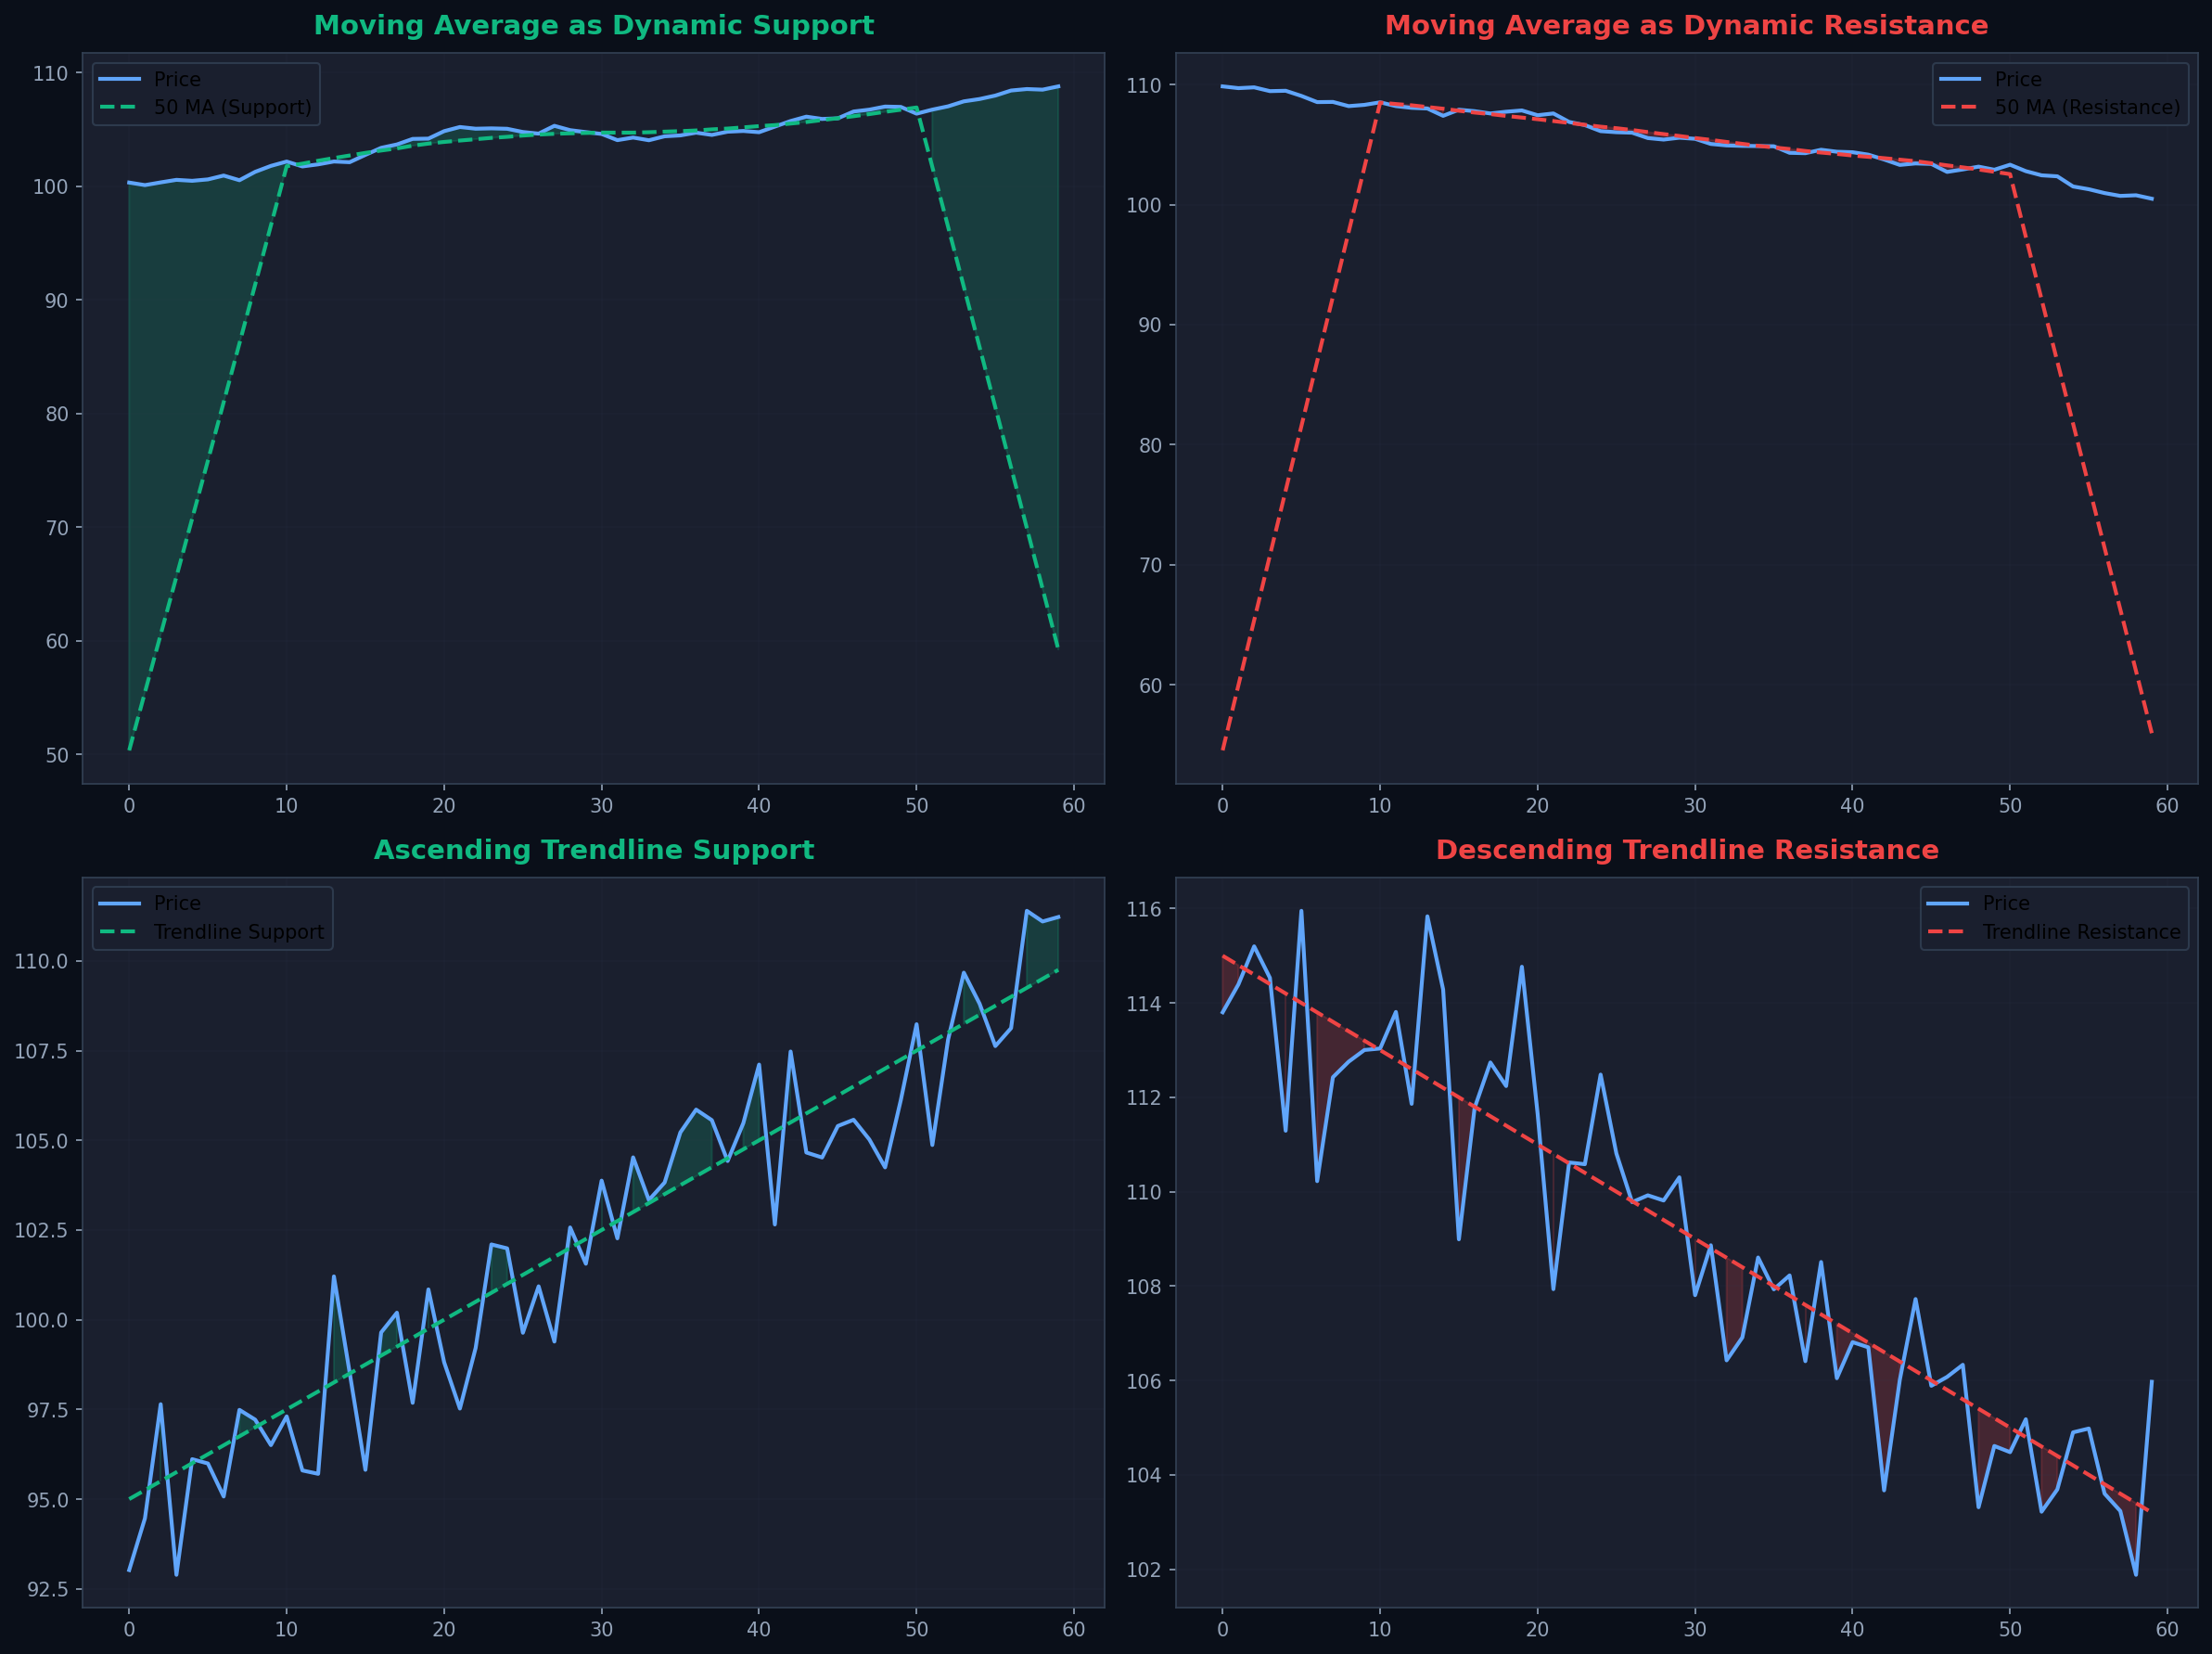
In uptrends: MAs act as support. Price pulls back to the MA and bounces.
In downtrends: MAs act as resistance. Price rallies to the MA and reverses.
Trading Strategy: MA Bounce
- Setup: Strong trend with price respecting a specific MA
- Entry: When price touches MA and shows reversal candle
- Stop Loss: Below MA (for uptrend) or above MA (for downtrend)
- Target: Previous swing high/low or 2:1 risk-reward
- Confirmation: Bullish candle at support MA, bearish at resistance MA
MA Confluence
When multiple MAs cluster together, they create a strong dynamic support or resistance zone. Example: 50 EMA, 100 SMA, and 200 SMA all within 2% creates a powerful level.
Trendlines as Dynamic S&R
How to Draw Trendlines
Uptrend trendline (support):
- Connect two or more swing lows
- Line should slope upward
- More touches = stronger trendline
- Use candle bodies, not wicks
Downtrend trendline (resistance):
- Connect two or more swing highs
- Line should slope downward
- More touches = stronger trendline
- Use candle bodies, not wicks
Pro Tip: A valid trendline needs at least 3 touches. Two points draw a line; three points confirm a trend.
Trading Strategy: Trendline Bounce
- Entry: When price approaches trendline and shows reversal
- Stop Loss: Just beyond the trendline
- Target: Opposite side of channel or previous high/low
- Confirmation: Volume increase on bounce
Trading Strategy: Trendline Break
- Entry: When price closes beyond trendline with volume
- Stop Loss: Back inside the trendline
- Target: Measured move or next major S&R level
- Significance: Trendline breaks often signal trend reversals
Combining Dynamic and Static S&R
The most powerful setups occur when dynamic and static levels align:
- 200 MA + previous swing low = very strong support
- Trendline + round number ($100) = powerful resistance
- 50 MA + horizontal support zone = high-probability bounce
Common Mistakes
❌ Forcing Trendlines
Don't force a trendline to fit. If it doesn't connect naturally, it's not valid.
❌ Using Too Many MAs
Stick to 2-3 key moving averages. More creates confusion.
❌ Ignoring Trend Context
MAs work best in trends. In ranging markets, use horizontal S&R instead.
Key Takeaways
- ✅ Dynamic S&R moves with price, ideal for trending markets
- ✅ 50, 100, and 200 MAs are most widely watched and respected
- ✅ MAs act as support in uptrends, resistance in downtrends
- ✅ Trendlines need at least 3 touches to be valid
- ✅ Trendline breaks often signal trend reversals
- ✅ Combine dynamic and static S&R for strongest setups
- ✅ Use candle bodies, not wicks, for trendline drawing
- ✅ MA confluence creates powerful support/resistance zones
Related Articles
Ready to Put This Into Practice?
Join MarketDly to access real-time market insights, AI-powered analysis, and professional trading tools.
No credit card required • Free tier available • Upgrade anytime