Support and Resistance: The Foundation of Technical Analysis
Support and resistance levels are the most fundamental concepts in technical analysis. Understanding these price levels where buying and selling pressure concentrate is essential for every trader, regardless of strategy or timeframe.
What Are Support and Resistance?
Support and resistance are price levels where the forces of supply and demand meet. These levels act as psychological and technical barriers that price tends to respect, creating predictable patterns of behavior.
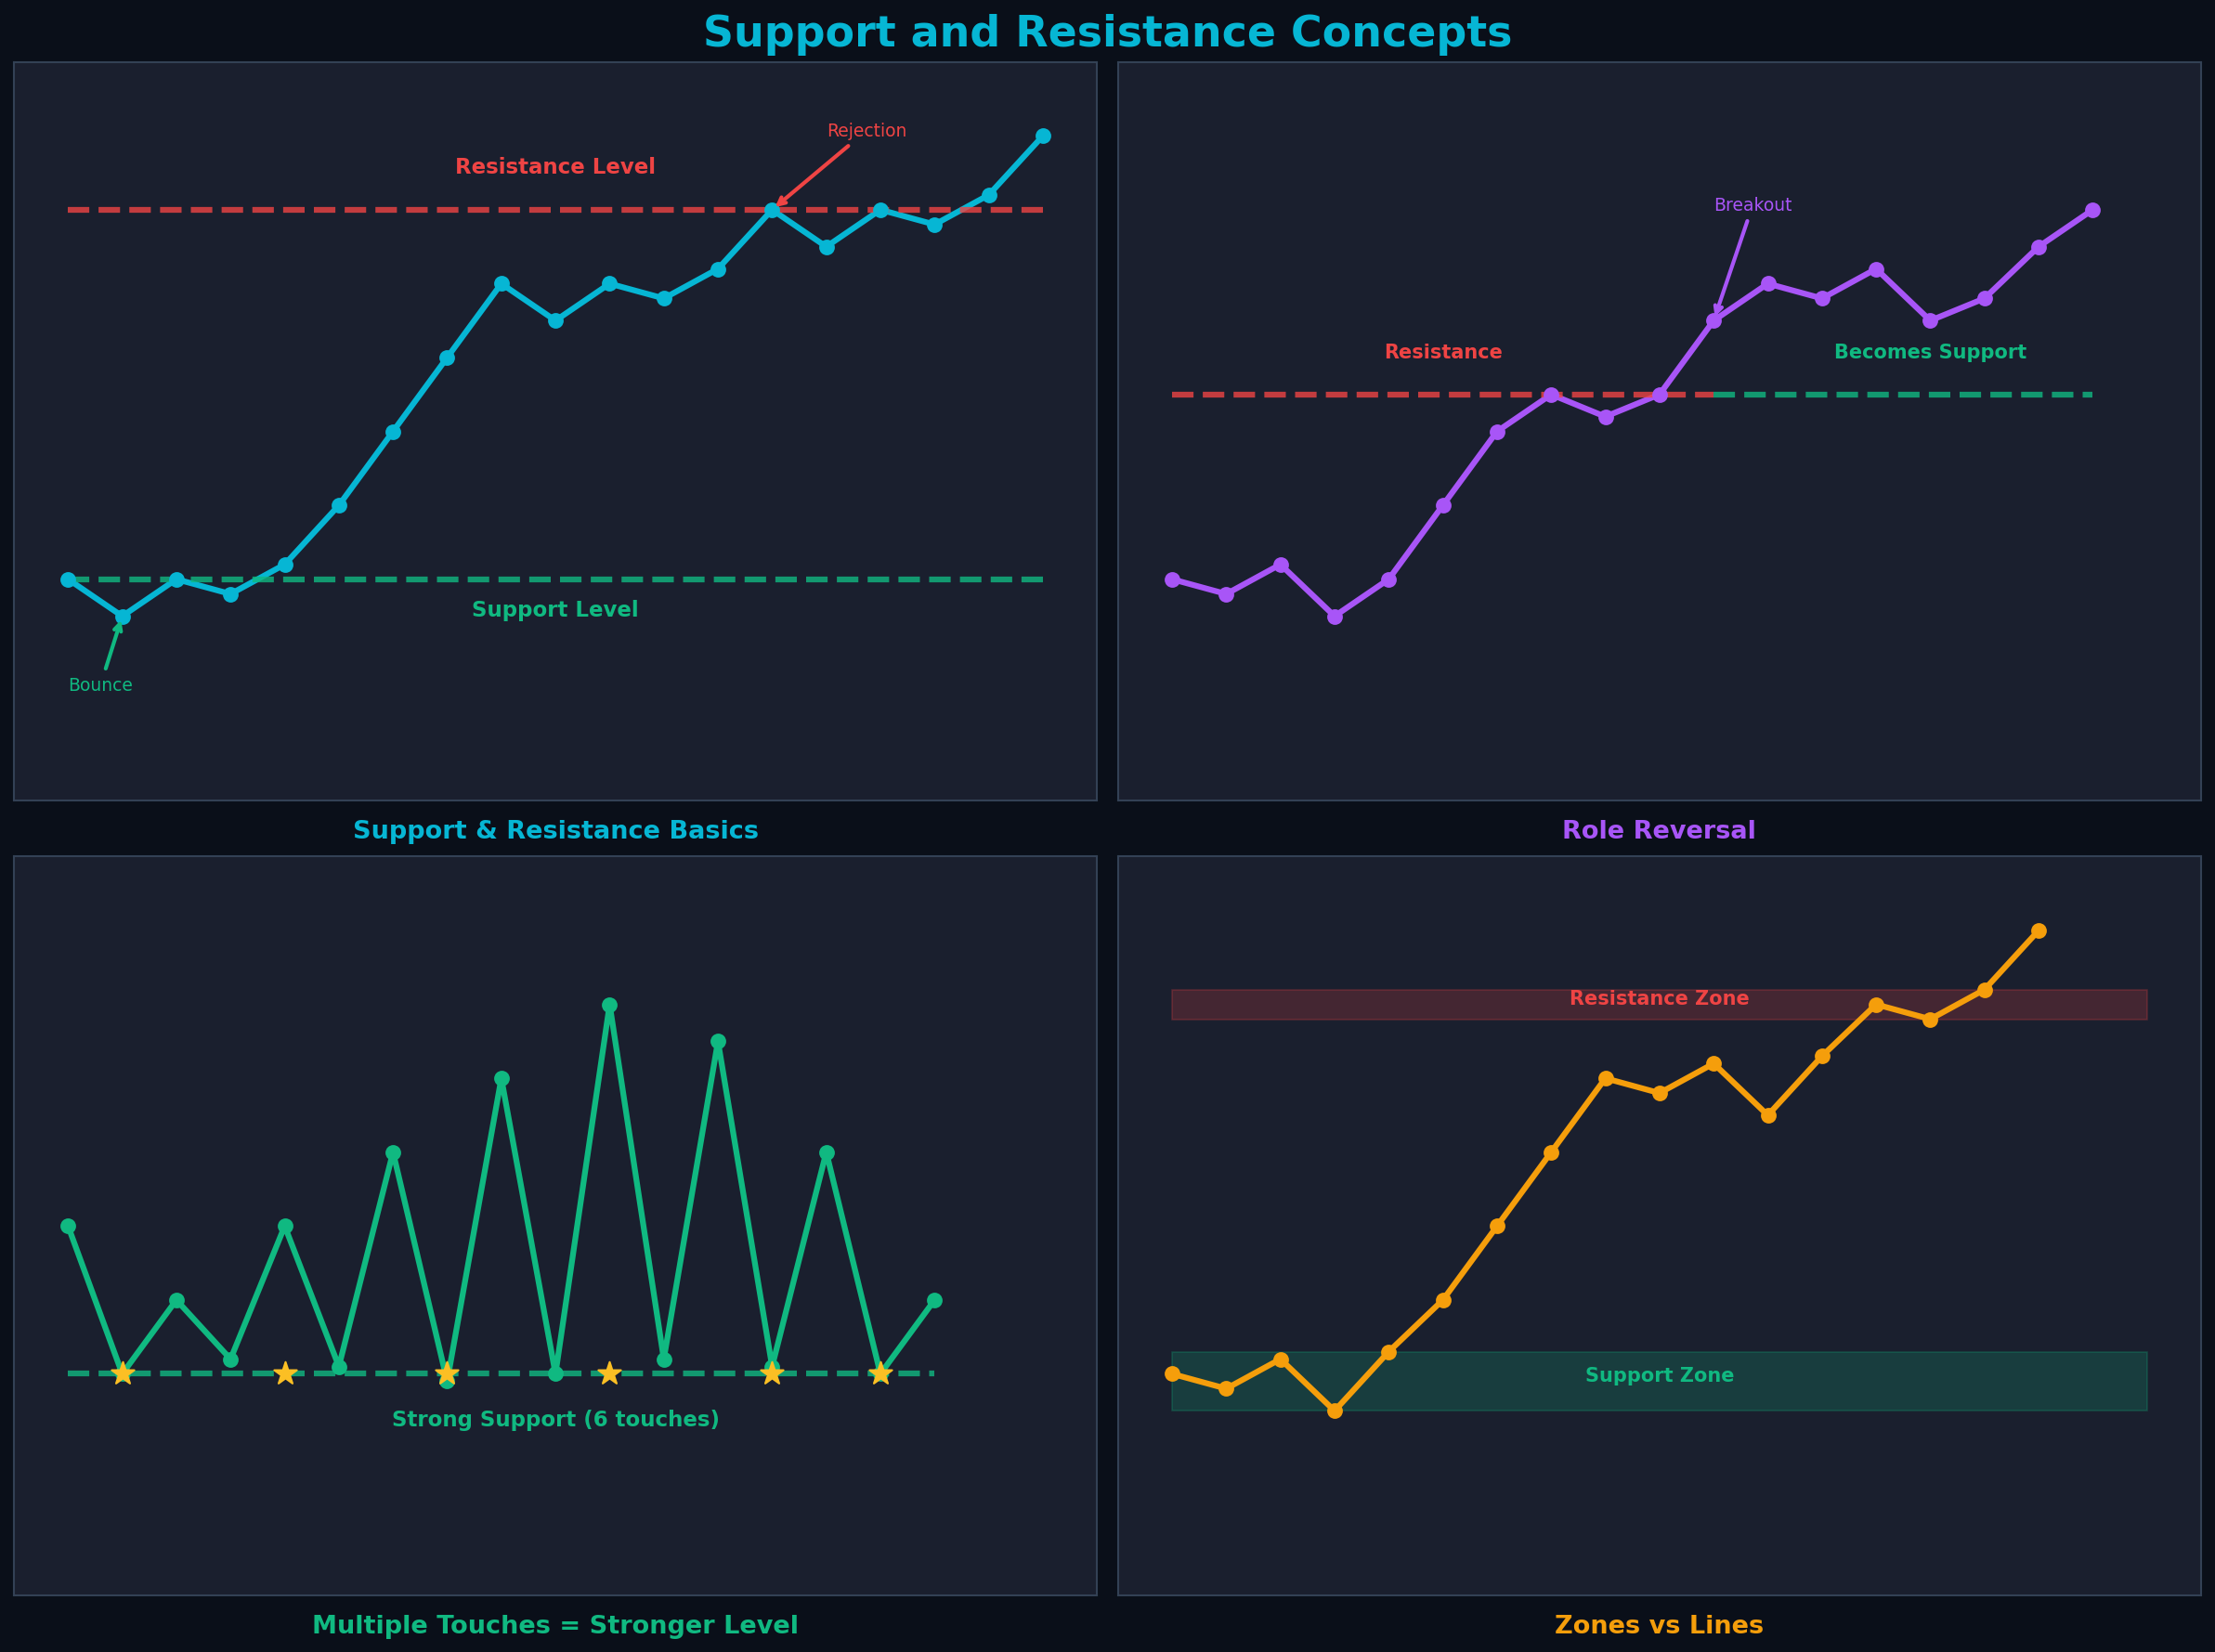
Support is a price level where buying pressure is strong enough to prevent price from falling further. It acts as a floor.
Resistance is a price level where selling pressure is strong enough to prevent price from rising further. It acts as a ceiling.
The Psychology Behind S&R Levels
Support and resistance exist because of human psychology and market memory. When price reaches a level where significant trading activity occurred previously, traders remember and react:
At Support Levels
- Buyers who missed the previous low see another opportunity to enter
- Short sellers take profits, creating buying pressure
- Current holders add to positions at favorable prices
- Stop losses from shorts get triggered, forcing buy orders
At Resistance Levels
- Sellers who missed the previous high get another chance to exit
- Long traders take profits, creating selling pressure
- New short sellers enter positions expecting reversal
- Stop losses from longs get triggered, forcing sell orders
How to Identify Support and Resistance
1. Horizontal Levels (Most Common)
Look for price levels where the market has reversed multiple times. The more times price bounces off a level, the stronger it becomes. Connect swing highs for resistance and swing lows for support.
Rule of thumb: A level needs at least 2 touches to be considered valid. Three or more touches indicate a strong level.
2. Round Numbers (Psychological Levels)
Humans naturally gravitate toward round numbers. Levels like $100, $50, $1,000 often act as support or resistance because traders place orders at these psychologically significant prices.
3. Previous Highs and Lows
Historical price extremes carry memory. Previous all-time highs, yearly highs/lows, and significant swing points often act as future support or resistance levels.
4. Moving Averages
Dynamic support and resistance levels. The 50-day, 100-day, and 200-day moving averages are widely watched and often act as support in uptrends and resistance in downtrends.
The Concept of Role Reversal
One of the most powerful concepts in technical analysis is that support becomes resistance and resistance becomes support once broken.
When support breaks: The level that previously held price up now acts as a ceiling, preventing price from rising back above it.
When resistance breaks: The level that previously capped price now acts as a floor, supporting price on pullbacks.
This happens because traders who bought at support and held through the break now want to exit at breakeven. Similarly, traders who sold at resistance and missed the breakout want to re-enter on pullbacks.
Strength of Support and Resistance
Not all levels are created equal. Several factors determine the strength of a support or resistance level:
| Factor | Impact on Strength |
|---|---|
| Number of Touches | More touches = stronger level (but also more likely to break eventually) |
| Volume at Level | High volume = stronger level (more traders involved) |
| Time Frame | Weekly/monthly levels stronger than daily/hourly |
| Recency | Recent levels more relevant than ancient history |
| Round Numbers | Psychological significance adds strength |
| Confluence | Multiple factors at same level = very strong |
Trading Strategies Using S&R
Strategy 1: Bounce Trades
The most common approach - buy at support, sell at resistance.
- Entry: When price approaches support/resistance and shows reversal signals
- Stop Loss: Just beyond the support/resistance level
- Target: Opposite support/resistance level or risk-reward ratio of 2:1 minimum
- Confirmation: Wait for candlestick patterns or momentum indicators
Strategy 2: Breakout Trades
Trade the break of support or resistance for momentum moves.
- Entry: On confirmed break with increased volume
- Stop Loss: Back inside the broken level
- Target: Measured move (distance from previous swing to breakout level)
- Confirmation: Volume spike and strong momentum candle
Strategy 3: Pullback After Breakout
Wait for price to retest the broken level (role reversal) before entering.
- Entry: When price pulls back to test broken support/resistance
- Stop Loss: Below the retest low (for resistance turned support)
- Target: Next major support/resistance level
- Advantage: Better risk-reward ratio than immediate breakout entry
Common Mistakes to Avoid
❌ Drawing Too Many Lines
Focus on the most obvious, well-tested levels. A chart cluttered with lines is useless. Quality over quantity.
❌ Expecting Exact Touches
Support and resistance are zones, not precise lines. Allow for 1-2% variance around the level.
❌ Ignoring Volume
A break without volume is likely a false breakout. Always confirm with volume analysis.
❌ Trading Every Touch
Not every approach to support/resistance is tradeable. Wait for confirmation signals.
❌ Forgetting Context
Support in a downtrend is weaker than support in an uptrend. Always consider the bigger picture.
Support and Resistance Zones
Professional traders think in terms of zones rather than exact lines. A support zone might span $48-$50 rather than exactly $49. This accounts for:
- Market noise and volatility
- Different timeframes showing slightly different levels
- Psychological round numbers within the zone
- Stop loss hunting by institutional traders
Pro Tip: Draw a zone by connecting the bodies of candles, not the wicks. Wicks represent temporary price action; bodies show where price actually settled.
Time Frame Considerations
Support and resistance levels exist on all timeframes, but their significance varies:
| Time Frame | Characteristics | Best For |
|---|---|---|
| Monthly/Weekly | Very strong, rarely broken, major turning points | Long-term investors, swing traders |
| Daily | Strong, widely watched, good reliability | Swing traders, position traders |
| 4-Hour | Moderate strength, good for intraday context | Day traders, swing traders |
| 1-Hour | Short-term levels, more frequent breaks | Day traders |
| 15-Min/5-Min | Weak, noisy, frequent false breaks | Scalpers, very short-term traders |
Multi-Timeframe Analysis: Always check higher timeframes for major S&R levels. A daily resistance level will override an hourly support level.
Volume and S&R Levels
Volume provides crucial confirmation for support and resistance analysis:
At Support
- High volume bounce: Strong support, buyers stepping in aggressively
- Low volume bounce: Weak support, may break on next test
- High volume break: Confirmed breakdown, likely to continue lower
- Low volume break: Possible false breakdown, watch for reversal
At Resistance
- High volume rejection: Strong resistance, sellers in control
- Low volume rejection: Weak resistance, may break on next test
- High volume breakout: Confirmed breakout, likely to continue higher
- Low volume breakout: Possible false breakout, watch for failure
Practical Examples
Example 1: Strong Support Hold
Stock XYZ has bounced off $50 three times in the past two months with high volume each time. On the fourth approach, price forms a hammer candlestick at $50.20 with volume 50% above average. This is a high-probability long setup with stop loss at $49.50 and target at previous resistance of $55.
Example 2: Resistance Breakout
Stock ABC has tested $100 resistance four times over three months. On the fifth attempt, price breaks above $100 with a strong bullish candle and volume 200% above average. After consolidating at $101-$102 for two days, price continues to $108. The $100 level now acts as support on any pullback.
Example 3: False Breakout
Stock DEF breaks below $75 support with low volume. Price drops to $74.50 but quickly reverses back above $75 within the same day. This false breakdown traps short sellers and often leads to a strong rally as they cover positions. The failed break actually strengthens the support level.
Advanced Concepts
Confluence Zones
When multiple support or resistance factors align at the same price level, you have a confluence zone. These are the strongest levels to trade. Examples include:
- Previous swing low + 200-day MA + round number ($50)
- Previous high + Fibonacci retracement + trend line
- Multiple timeframe support (daily and weekly align)
Support/Resistance Clusters
Sometimes you'll see multiple support or resistance levels close together, creating a cluster. These act as strong barriers because price must break through multiple levels to continue. Think of them as multiple walls rather than a single wall.
Key Takeaways
- ✅ Support and resistance are price levels where supply and demand create barriers
- ✅ These levels exist due to market psychology and trader memory
- ✅ Broken support becomes resistance; broken resistance becomes support
- ✅ Strength depends on touches, volume, timeframe, and confluence
- ✅ Think in zones (ranges) rather than exact lines
- ✅ Higher timeframe levels are more significant than lower timeframe levels
- ✅ Volume confirms the validity of bounces and breaks
- ✅ Wait for confirmation before trading - not every touch is tradeable
- ✅ Confluence zones (multiple factors at same level) are strongest
- ✅ Context matters - consider the overall trend and market conditions
Next Steps
Now that you understand the basics of support and resistance, you can explore more advanced concepts like dynamic support and resistance (moving averages, trend lines), psychological levels and round numbers, and how to combine S&R with other technical tools for higher probability setups.
Practice identifying support and resistance levels on your charts. Start with daily timeframes and major levels. As you gain experience, you'll develop an eye for the most significant levels and learn to filter out the noise.
Related Articles
Ready to Put This Into Practice?
Join MarketDly to access real-time market insights, AI-powered analysis, and professional trading tools.
No credit card required • Free tier available • Upgrade anytime