Support and Resistance Zones: Trading Price Ranges Not Lines
Professional traders don't draw exact lines - they identify zones. Understanding why support and resistance are ranges rather than precise levels will dramatically improve your trading accuracy.
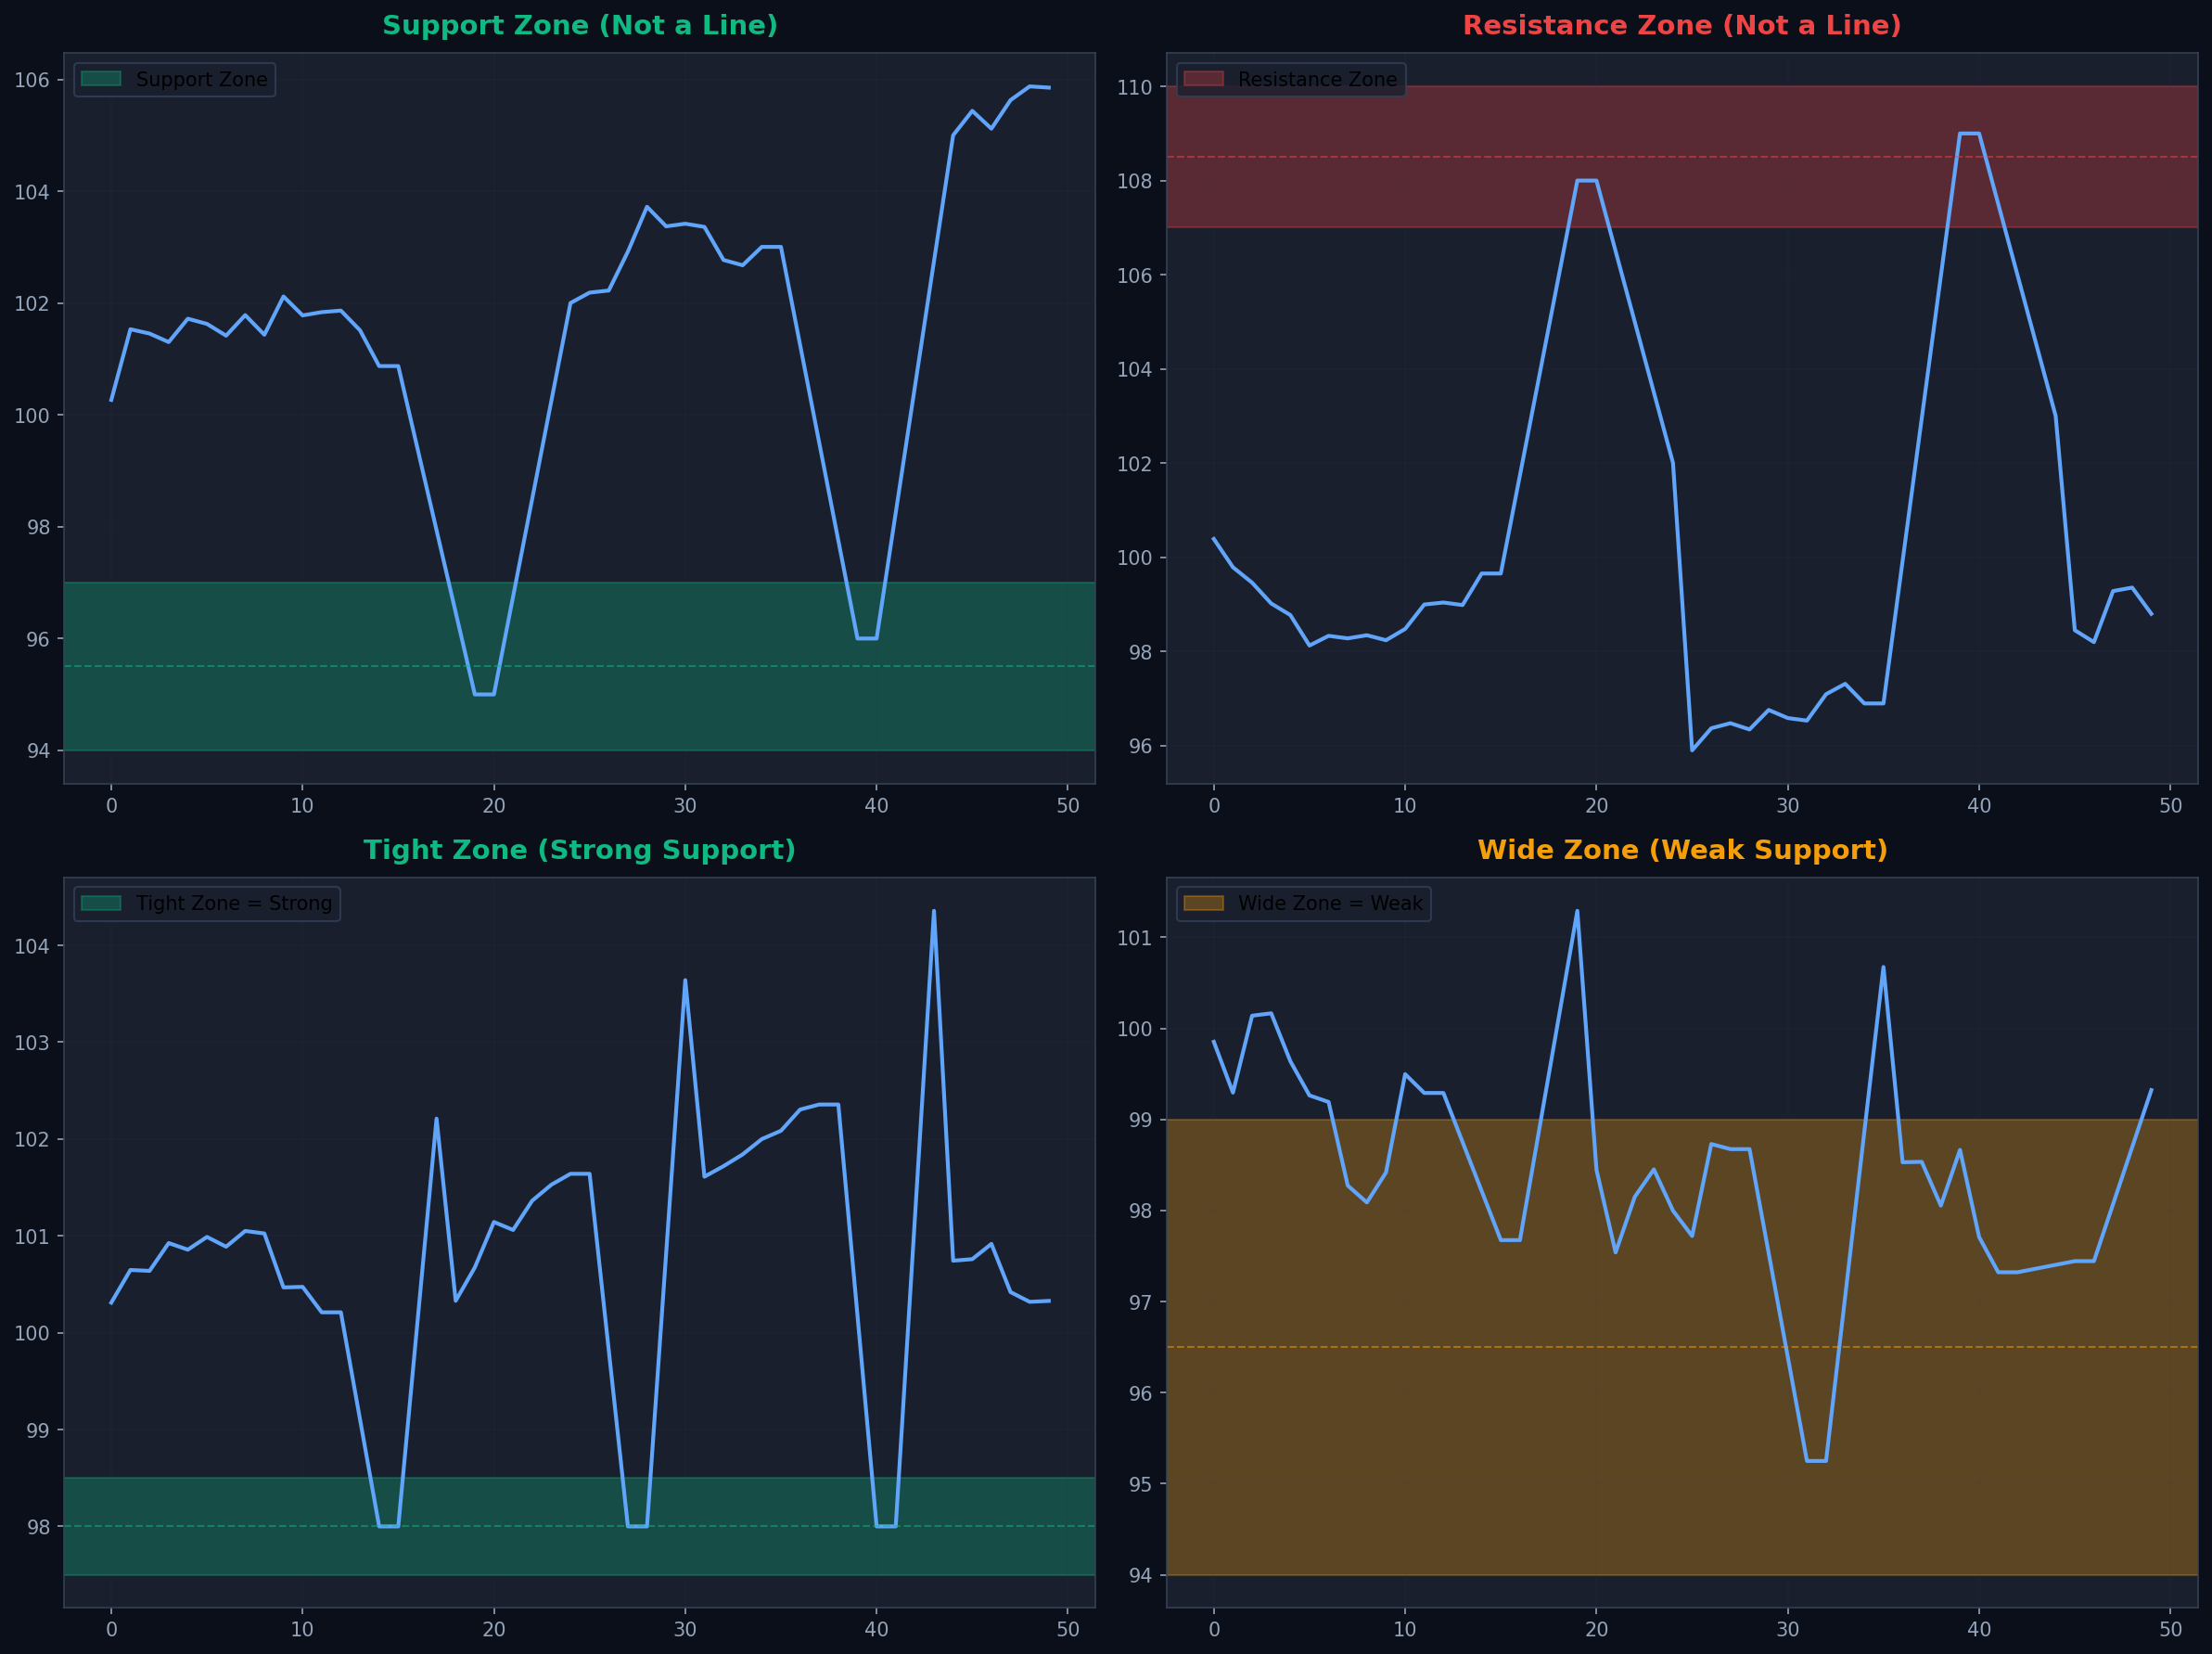
Why Zones, Not Lines?
The market doesn't respect exact price levels. Support and resistance are areas where supply and demand concentrate, not mathematical points. Thinking in zones accounts for:
- Market noise and volatility - Price fluctuates naturally
- Different timeframes - Daily vs hourly charts show different levels
- Order clustering - Traders place orders across a range
- Stop hunting - Institutions push price through obvious levels
- Psychological variation - Not everyone sees the same exact level
Key Insight: A zone approach gives you flexibility and prevents false signals from minor price penetrations.
How to Identify Zones
Method 1: Candle Body Approach
Draw your zone using candle bodies, not wicks. Wicks represent temporary price action; bodies show where price actually settled and where most trading occurred.
- Find multiple swing lows (for support) or highs (for resistance)
- Draw upper boundary at highest body close in the cluster
- Draw lower boundary at lowest body close in the cluster
- Ignore extreme wicks unless they're consistently present
Method 2: Percentage Range
Use a fixed percentage around your identified level:
| Asset Type | Typical Zone Width |
|---|---|
| Stocks (low volatility) | 0.5-1% around level |
| Stocks (high volatility) | 1-2% around level |
| Forex major pairs | 0.3-0.5% around level |
| Cryptocurrencies | 2-5% around level |
| Indices | 0.5-1% around level |
Method 3: ATR-Based Zones
Use Average True Range (ATR) to create dynamic zones that adjust to volatility. A common approach is to use 0.5 ATR above and below your identified level.
Zone Width and Strength
Tight zones (narrow range) indicate strong, well-defined support or resistance. Price consistently respects a specific area.
Wide zones (broad range) indicate weak, poorly-defined levels. Price bounces from various points within a large area.
Trading implication: Tight zones offer better risk-reward ratios because you can place tighter stops. Wide zones require larger stops and offer less predictable entries.
Trading Strategies with Zones
Strategy 1: Zone Entry
- Entry: When price enters the zone and shows reversal signals
- Stop Loss: Just beyond the far edge of the zone
- Confirmation: Bullish candle pattern at support zone, bearish at resistance
- Advantage: Better entries than waiting for exact level touch
Strategy 2: Zone Breakout
- Entry: When price closes beyond the entire zone with volume
- Stop Loss: Back inside the zone
- Confirmation: Strong momentum candle + volume spike
- Advantage: Reduces false breakout signals
Strategy 3: Zone Retest
- Entry: After breakout, when price pulls back into the zone
- Stop Loss: If price closes back through the zone
- Confirmation: Price respects the zone as new support/resistance
- Advantage: Excellent risk-reward ratio
Common Mistakes
❌ Making Zones Too Wide
If your zone spans 5-10%, it's useless. Keep zones tight and meaningful.
❌ Treating Zones as Exact Lines
The whole point is flexibility. Don't expect perfect touches to zone edges.
❌ Ignoring Zone Context
A support zone in a downtrend is weaker than one in an uptrend.
Key Takeaways
- ✅ Support and resistance are zones, not exact lines
- ✅ Use candle bodies, not wicks, to define zones
- ✅ Tight zones are stronger than wide zones
- ✅ Adjust zone width based on asset volatility
- ✅ Enter when price enters the zone, not at exact level
- ✅ Place stops beyond the zone, not at the zone edge
- ✅ Confirm breakouts only when price closes beyond entire zone
- ✅ Zone retests offer excellent risk-reward opportunities
Related Articles
Ready to Put This Into Practice?
Join MarketDly to access real-time market insights, AI-powered analysis, and professional trading tools.
No credit card required • Free tier available • Upgrade anytime