Moving Average Crossover Strategies: Golden Cross & Death Cross
Moving average crossovers are among the most popular trading signals in technical analysis. When a faster MA crosses above or below a slower MA, it signals potential trend changes. The most famous crossovers—the Golden Cross and Death Cross—are watched by traders worldwide and often trigger significant market moves.
💡 Why Crossovers Work
Crossovers work because they identify momentum shifts. When a fast MA crosses above a slow MA, it means recent prices are rising faster than the long-term average—a sign of strengthening bullish momentum.
Understanding MA Crossovers
A moving average crossover occurs when two MAs of different periods intersect. The signal's strength depends on:
- Period difference: Larger gaps (e.g., 50/200) give stronger signals
- Angle of cross: Sharp crosses indicate strong momentum
- Volume confirmation: High volume validates the signal
- Market context: Crossovers work best in trending markets
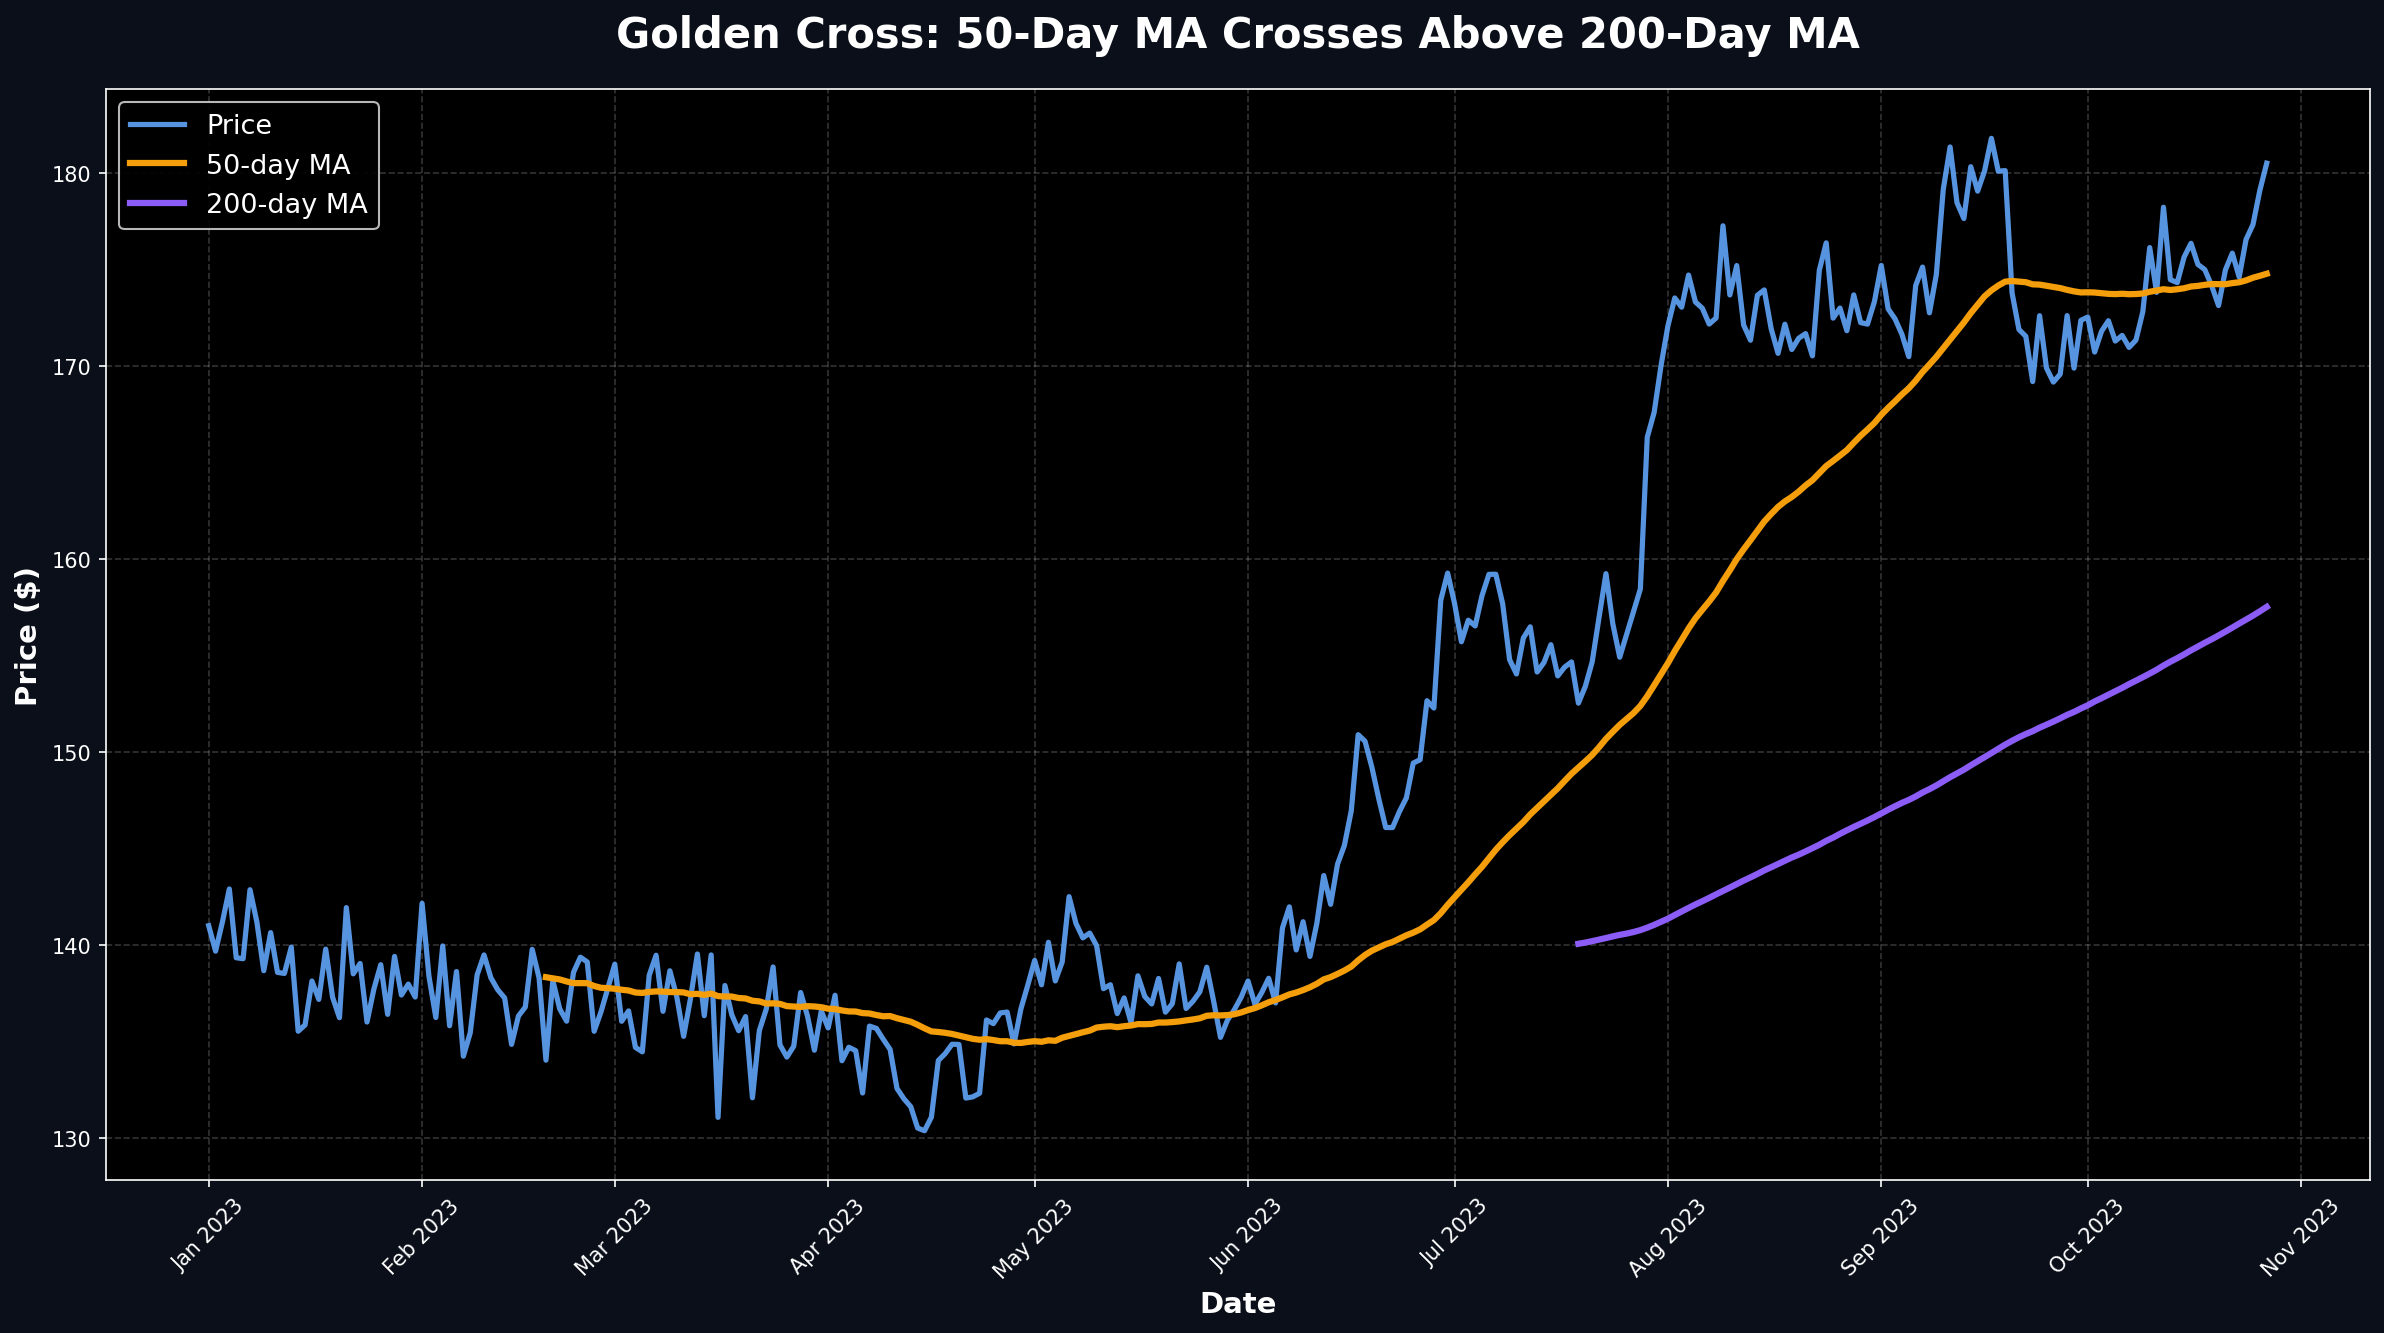
The Golden Cross
The Golden Cross is a bullish signal that occurs when a shorter-term MA crosses above a longer-term MA. The most famous is the 50-day MA crossing above the 200-day MA.
Golden Cross Criteria:
- ✓ 50 MA crosses above 200 MA
- ✓ Both MAs should be rising
- ✓ Price above both MAs
- ✓ Increasing volume on breakout
Historical Performance:
Studies show that Golden Crosses have led to positive returns in 60-70% of cases over the following 12 months. However, they're lagging indicators—the trend is often well underway by the time the cross occurs.
⚠️ Golden Cross Limitations
Golden Crosses can produce false signals in choppy markets. The signal occurs after significant upside has already happened, so you're often buying into an established trend rather than catching the bottom.
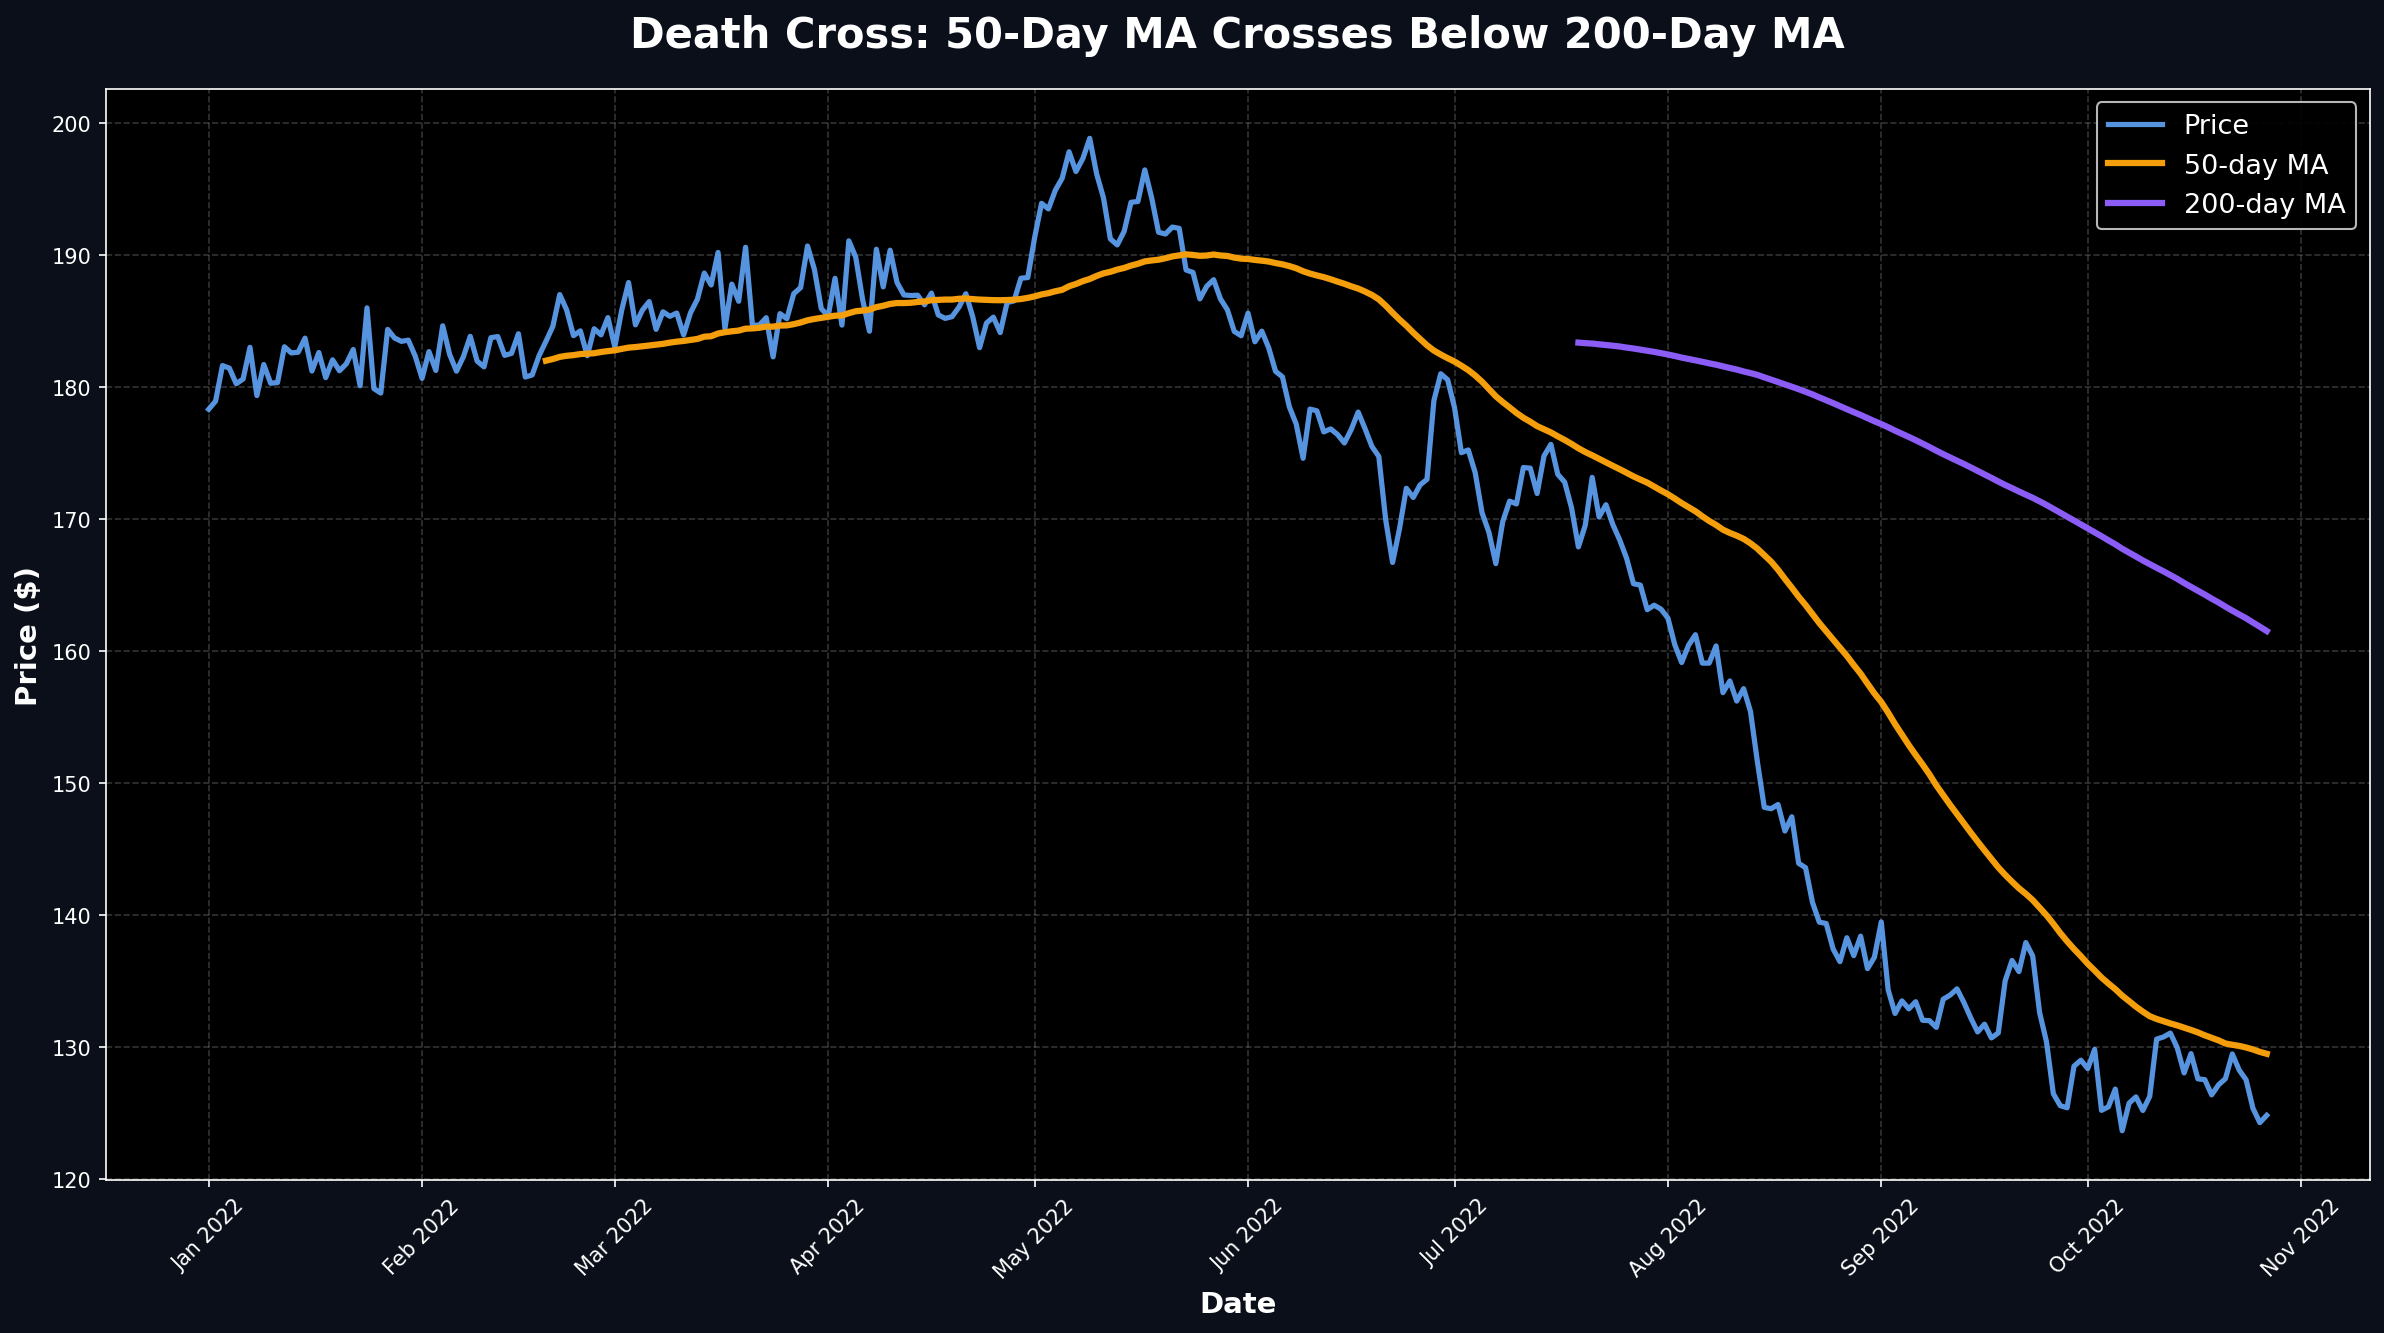
The Death Cross
The Death Cross is the bearish counterpart—when the 50 MA crosses below the 200 MA. It signals potential downtrend continuation or reversal.
Death Cross Criteria:
- ✓ 50 MA crosses below 200 MA
- ✓ Both MAs should be declining
- ✓ Price below both MAs
- ✓ Increasing volume on breakdown
Market Impact:
Death Crosses often trigger algorithmic selling and stop-loss orders, creating self-fulfilling prophecies. Major indices experiencing Death Crosses typically see increased volatility and continued weakness for several months.
Short-Term Crossover Strategies
While the 50/200 cross is most famous, shorter-term crossovers offer more frequent trading opportunities:
9/21 EMA Crossover
Popular for day trading and swing trading. Provides early signals but more false positives.
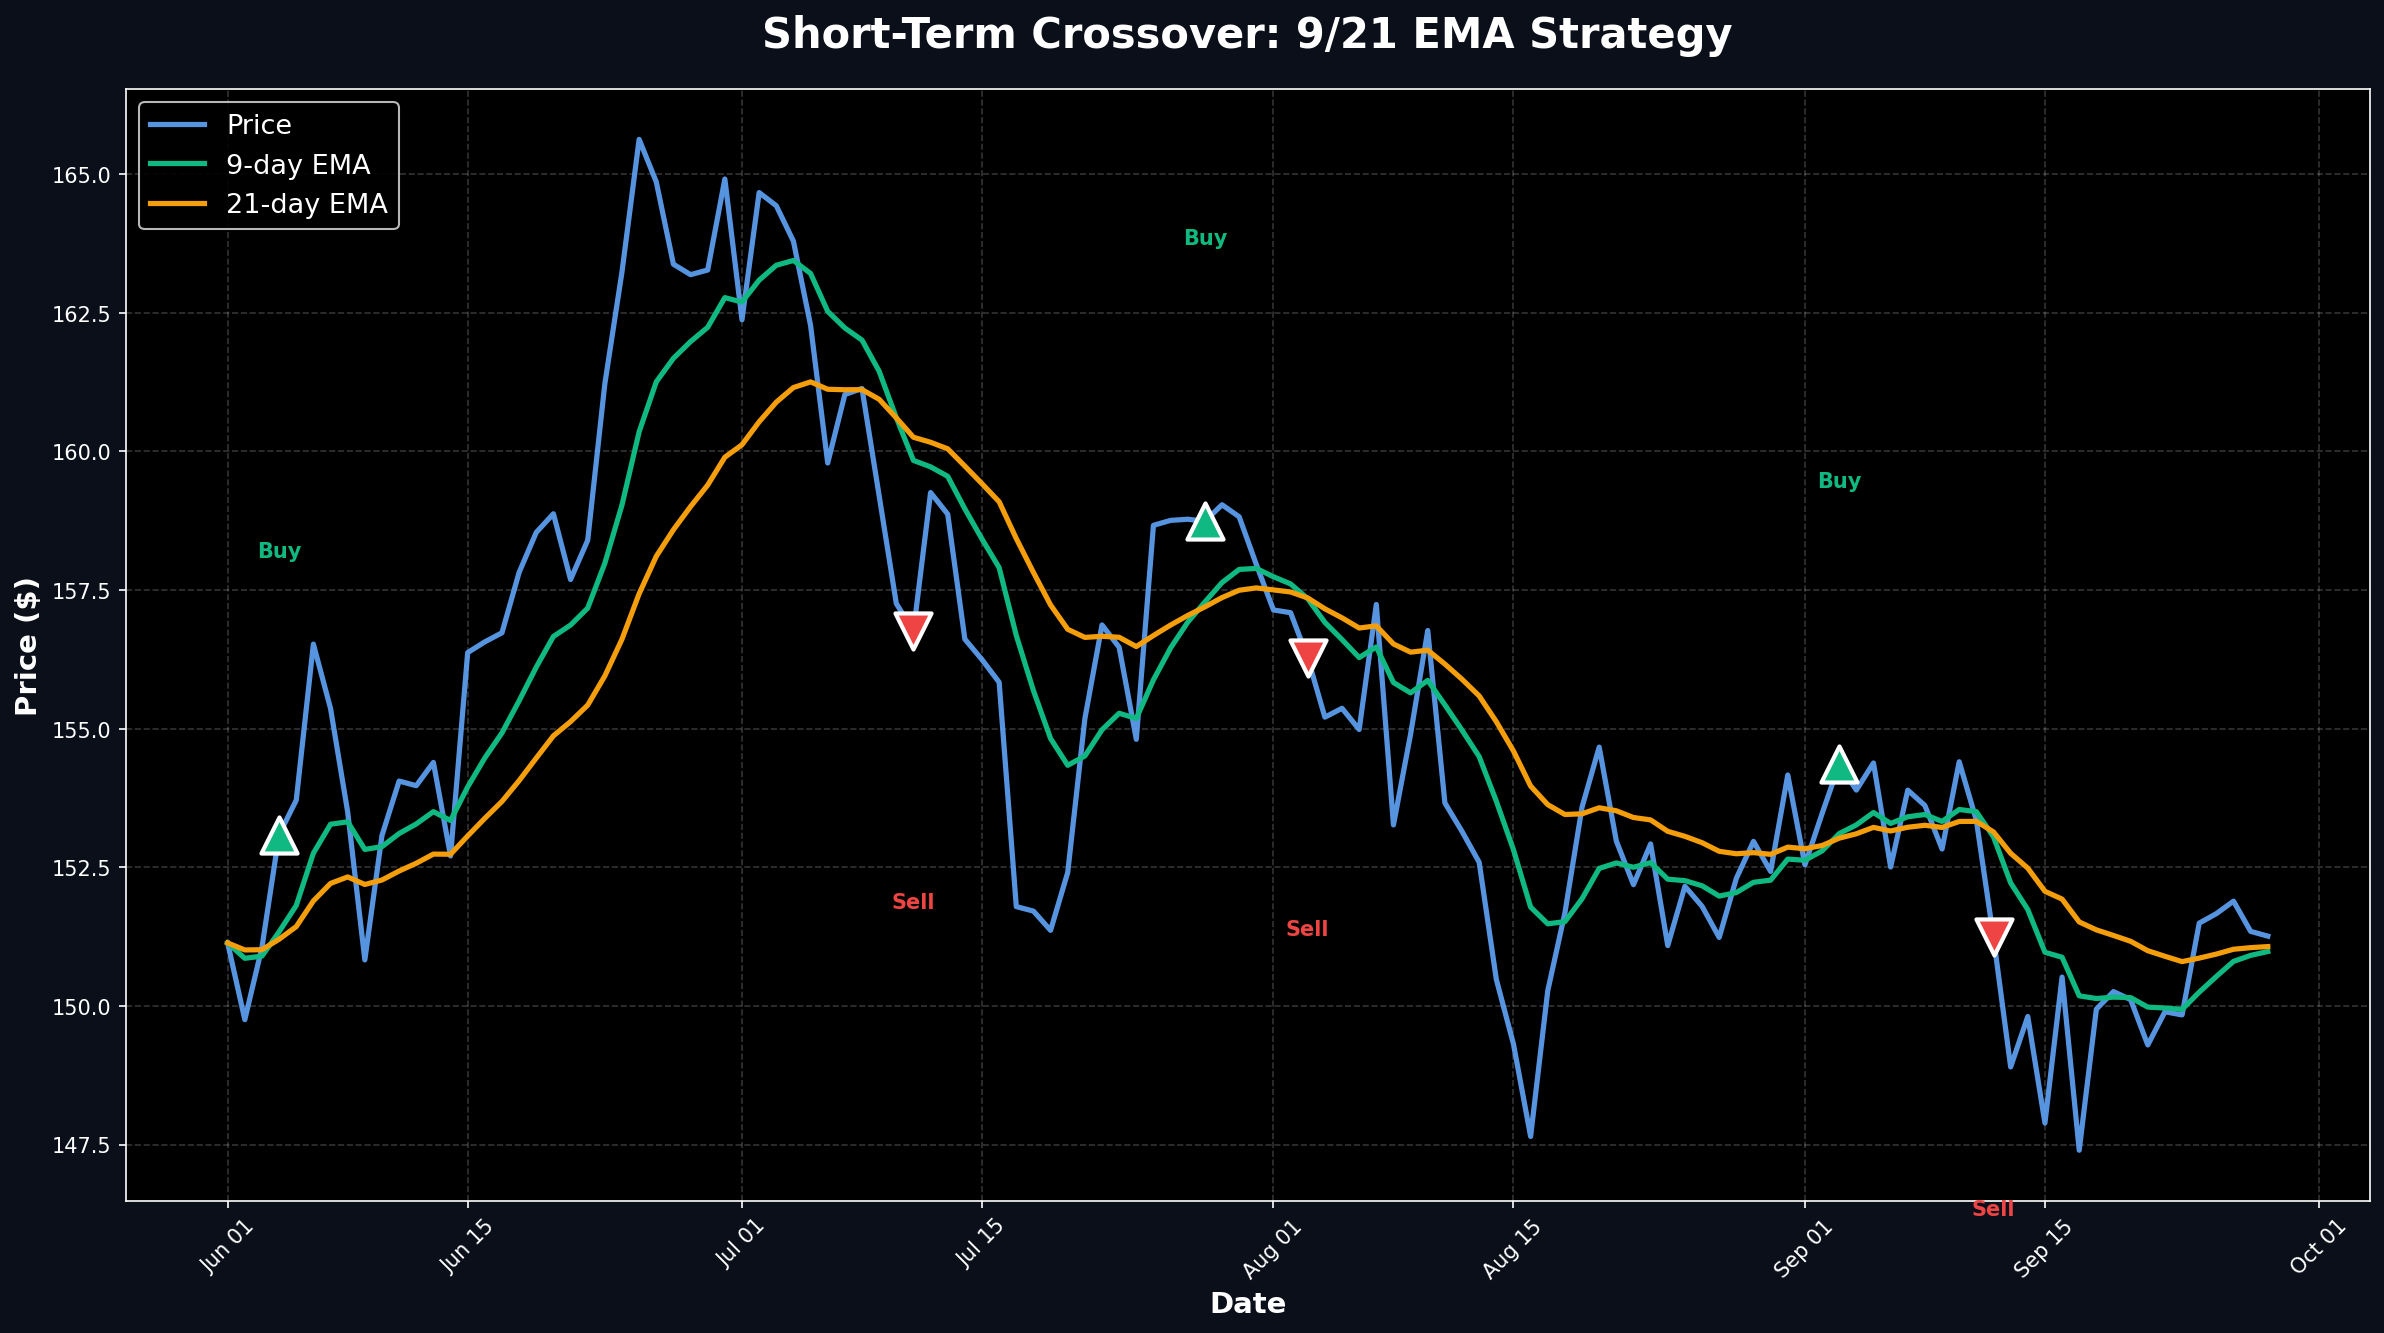
9/21 EMA Strategy:
- Entry: When 9 EMA crosses 21 EMA
- Confirmation: Price closes above/below both EMAs
- Stop Loss: Below recent swing low (bullish) or above swing high (bearish)
- Target: 2:1 risk-reward or next major S/R level
20/50 SMA Crossover
Balanced approach for swing traders. Less noise than 9/21 but more responsive than 50/200.
20/50 SMA Strategy:
- Timeframe: Daily charts for swing trades
- Entry: Wait for pullback to 20 SMA after cross
- Confirmation: Volume spike on cross
- Exit: When 20 SMA crosses back or price breaks 50 SMA
Triple MA Crossover System
Using three MAs (e.g., 10/20/50) provides additional confirmation and filters false signals.
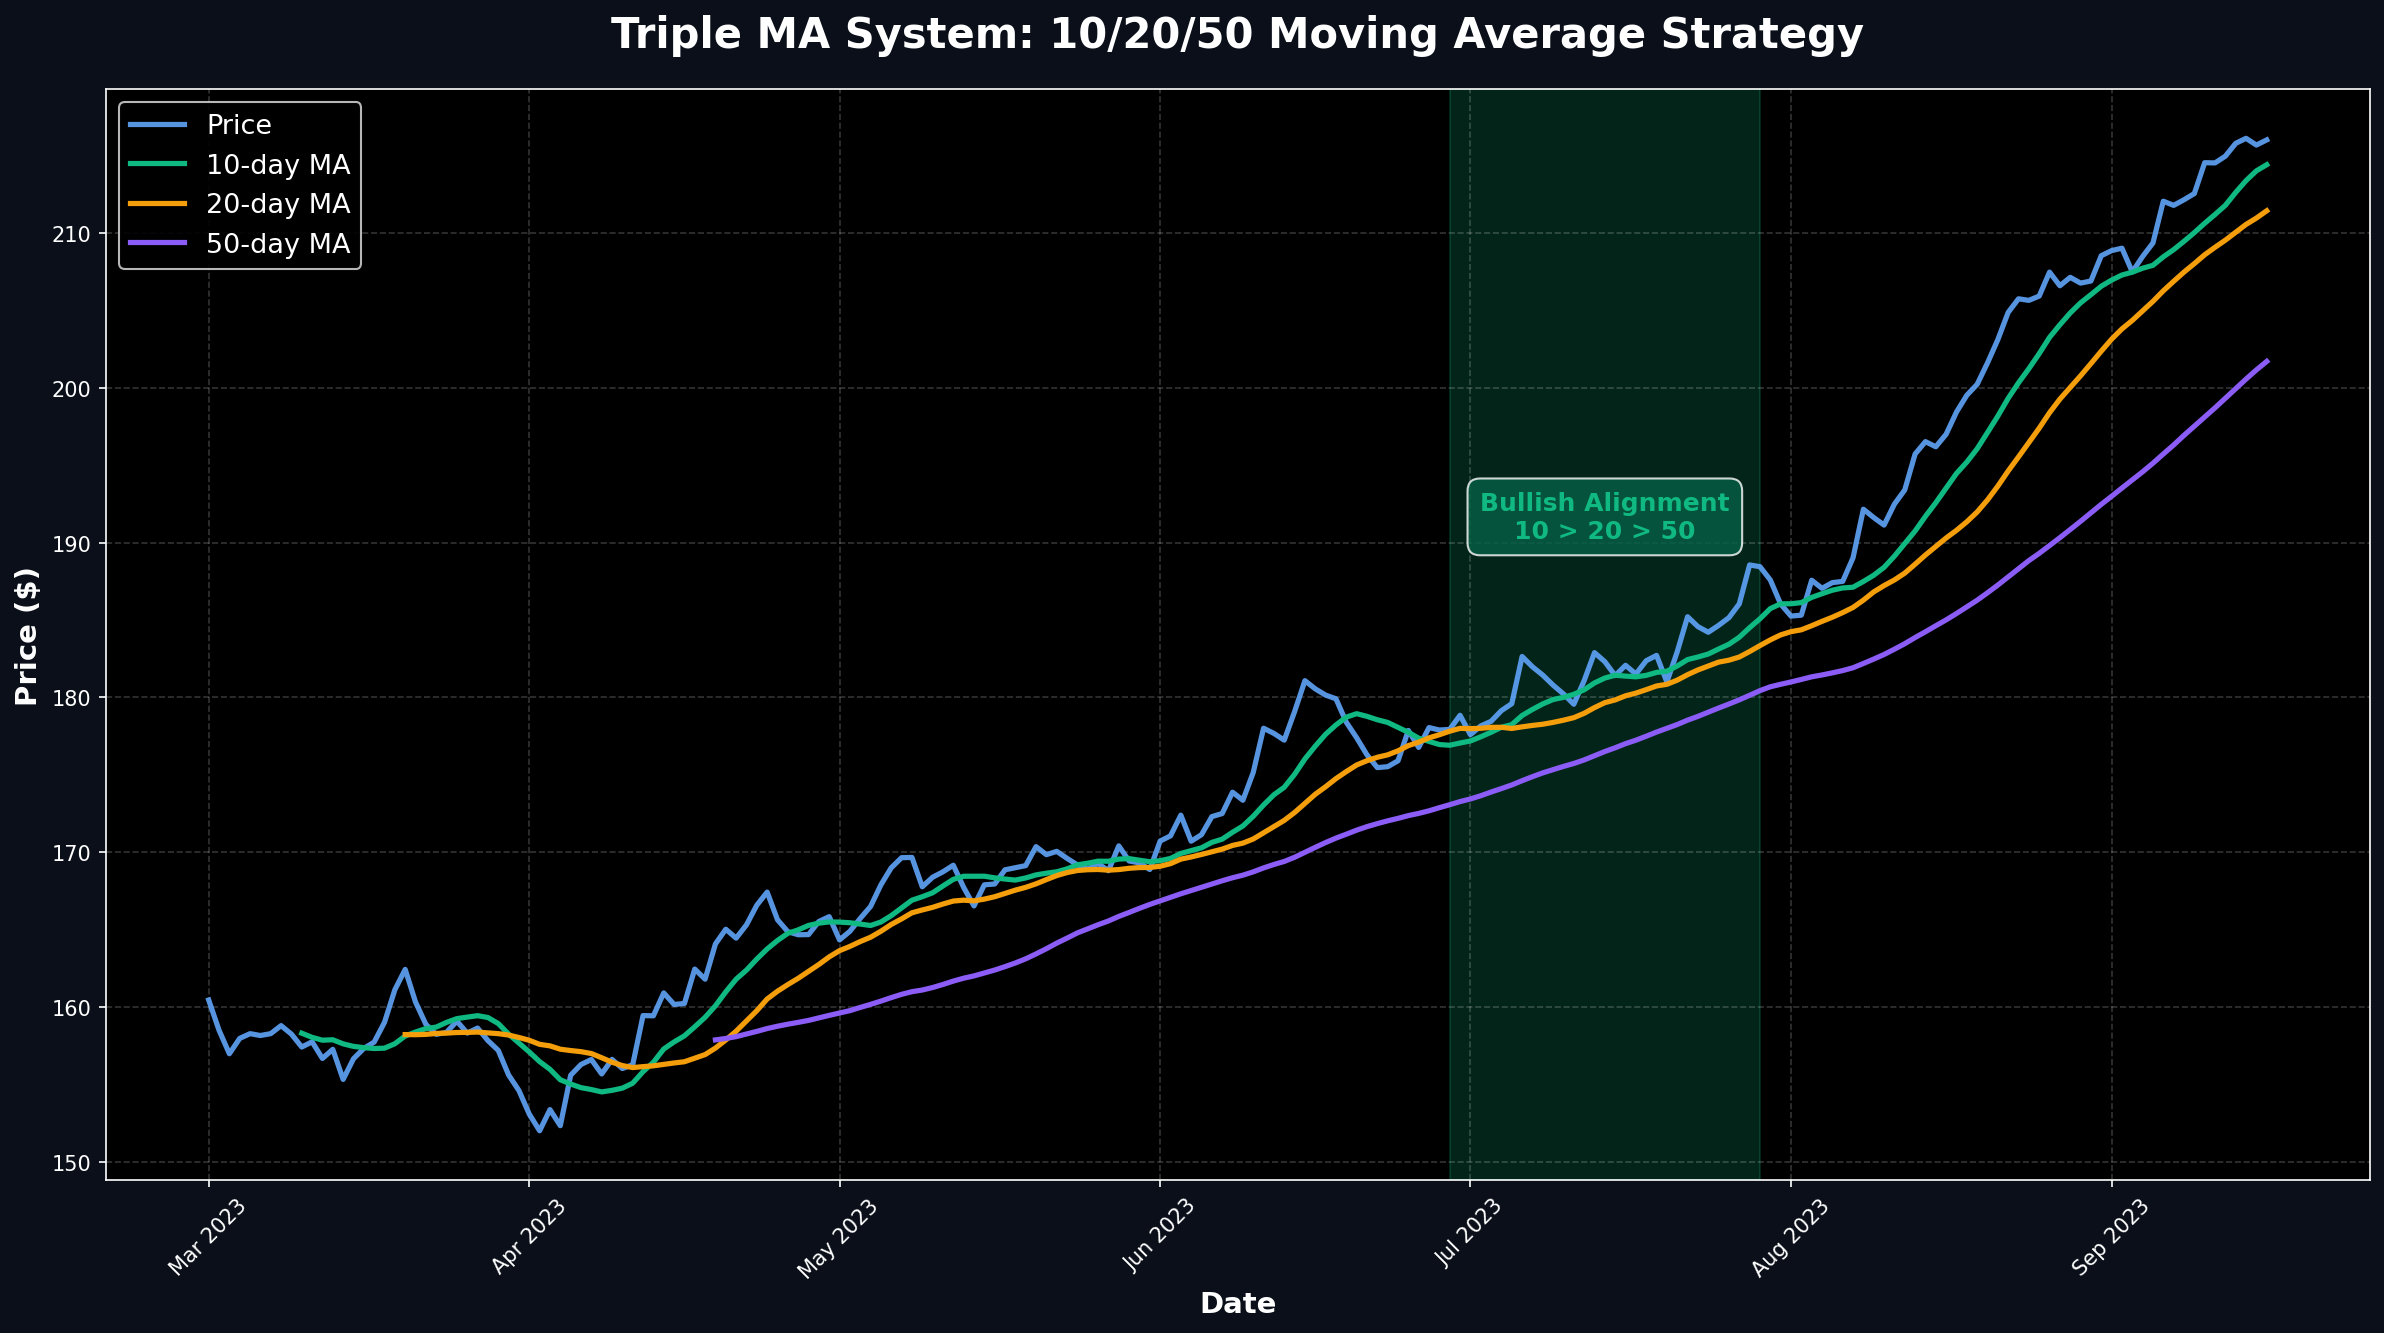
Triple MA Rules:
- Strong Bullish: 10 > 20 > 50, all rising
- Bullish Entry: Price pulls back to 20 MA, bounces
- Warning Sign: 10 MA crosses below 20 MA
- Exit Signal: 20 MA crosses below 50 MA
Avoiding False Signals
Crossovers generate many false signals in ranging markets. Here's how to filter them:
1. Trend Confirmation
Only trade crossovers in the direction of the higher timeframe trend. If the weekly chart shows an uptrend, only take bullish crossovers on the daily chart.
2. Volume Analysis
Require above-average volume on the crossover day. Low-volume crosses often fail quickly.
3. Price Action Confirmation
Wait for price to close above both MAs (bullish) or below both MAs (bearish) before entering.
4. Support/Resistance Context
Crossovers near major S/R levels are more reliable. A Golden Cross at a key resistance level may fail, while one at support has better odds.
Filter Checklist:
- ☐ Crossover aligns with higher timeframe trend
- ☐ Volume is above 20-day average
- ☐ Price closes beyond both MAs
- ☐ No major S/R level blocking the move
- ☐ Both MAs are sloping in signal direction
Real-World Examples
Example 1: AAPL Golden Cross (2023)
In January 2023, Apple's 50 MA crossed above its 200 MA at $145. The stock rallied to $195 over the next 6 months—a 34% gain. Key factors:
- Both MAs were rising at the time of cross
- Volume spiked 40% above average on breakout
- Price held above 50 MA on all pullbacks
- Broader market (SPY) was also in uptrend
Example 2: TSLA Death Cross (2022)
Tesla's 50 MA crossed below its 200 MA in April 2022 at $1,000. The stock fell to $620 by May—a 38% decline. Warning signs:
- 200 MA had already turned flat, then declined
- Multiple failed rallies to 50 MA before cross
- High volume on down days, low volume on up days
- Tech sector weakness confirmed the signal
Position Sizing and Risk Management
Crossover trades require careful risk management due to their lagging nature:
Risk Management Rules:
- Initial Stop: Below the slower MA (e.g., below 200 MA for Golden Cross)
- Position Size: Risk 1-2% of capital per trade
- Scaling In: Enter 50% on cross, 50% on pullback to fast MA
- Profit Taking: Take partial profits at 2R, let rest run
- Trailing Stop: Move stop to fast MA as trade progresses
Combining Crossovers with Other Indicators
Crossovers work best when combined with complementary indicators:
RSI Confirmation
A Golden Cross with RSI above 50 (but below 70) confirms bullish momentum without being overbought.
MACD Alignment
MACD crossing above its signal line simultaneously with MA crossover provides strong confirmation.
Volume Profile
Crossovers occurring near high-volume nodes (POC) have better follow-through than those in low-volume areas.
Common Mistakes to Avoid
❌ Mistake #1: Trading Every Crossover
Not all crossovers are equal. In choppy, sideways markets, crossovers produce frequent whipsaws. Only trade crossovers when the market is trending.
❌ Mistake #2: Ignoring the Lag
By the time a 50/200 cross occurs, the trend is often mature. Don't expect to catch the entire move—you're joining late.
❌ Mistake #3: No Stop Loss
Crossovers can fail. Always use stops. A common approach is to exit if price closes back below both MAs.
Backtesting Results
Studies of the 50/200 MA crossover on the S&P 500 (1950-2020) show:
Golden Cross Performance:
- Win Rate: 64% of signals profitable
- Average Gain: +15.2% over 12 months
- Average Loss: -7.8% on failed signals
- Best Conditions: Low volatility, rising 200 MA
Death Cross Performance:
- Win Rate: 58% of signals led to further decline
- Average Decline: -12.4% over 6 months
- False Signals: 42% reversed within 3 months
- Best Conditions: High volatility, declining 200 MA
Practical Trading Plan
Here's a complete crossover trading system you can implement:
50/200 MA Crossover System:
- Setup: 50 MA crosses 200 MA on daily chart
- Confirmation: Both MAs sloping in signal direction
- Entry: On close above/below both MAs with volume
- Stop Loss: 2 ATR below 200 MA (bullish) or above (bearish)
- Target 1: 2R (take 50% profit)
- Target 2: Trail stop at 50 MA (let 50% run)
- Exit: If 50 MA crosses back through 200 MA
Key Takeaways
- ✓ Crossovers identify momentum shifts but are lagging indicators
- ✓ Golden Cross (50 above 200) signals potential uptrend continuation
- ✓ Death Cross (50 below 200) warns of potential downtrend
- ✓ Shorter-term crosses (9/21, 20/50) offer more frequent signals
- ✓ Filter signals using volume, trend context, and price action
- ✓ Combine with other indicators (RSI, MACD) for confirmation
- ✓ Risk management is critical—use stops and position sizing
- ✓ Crossovers work best in trending markets, fail in ranges
Next Steps
Ready to implement crossover strategies? Start by:
- 1. Paper trading the 50/200 cross on major indices
- 2. Backtesting shorter-term crosses on your favorite stocks
- 3. Combining crossovers with support/resistance levels
- 4. Tracking your results to refine entry and exit rules
📚 Continue Learning
Explore our other moving average guides:
Ready to Put This Into Practice?
Join MarketDly to access real-time market insights, AI-powered analysis, and professional trading tools.
No credit card required • Free tier available • Upgrade anytime