Multiple Moving Average Systems: Triple MA, Ribbons & Guppy
While single moving averages and crossovers are powerful, using multiple MAs simultaneously provides superior trend confirmation, filters false signals, and reveals market structure that single MAs miss. Professional traders use systems with 3, 8, or even 12 moving averages to gauge trend strength and identify high-probability entries.
💡 Why Multiple MAs Work
Multiple MAs create a "consensus" view of the trend. When all MAs align in the same direction, it confirms strong momentum. When they compress, it signals consolidation. This multi-timeframe perspective reduces whipsaws and improves win rates.
The Triple MA System (10/20/50)
The triple MA system uses three moving averages to identify trend direction, strength, and entry points. The 10/20/50 combination is popular because it balances responsiveness with reliability.
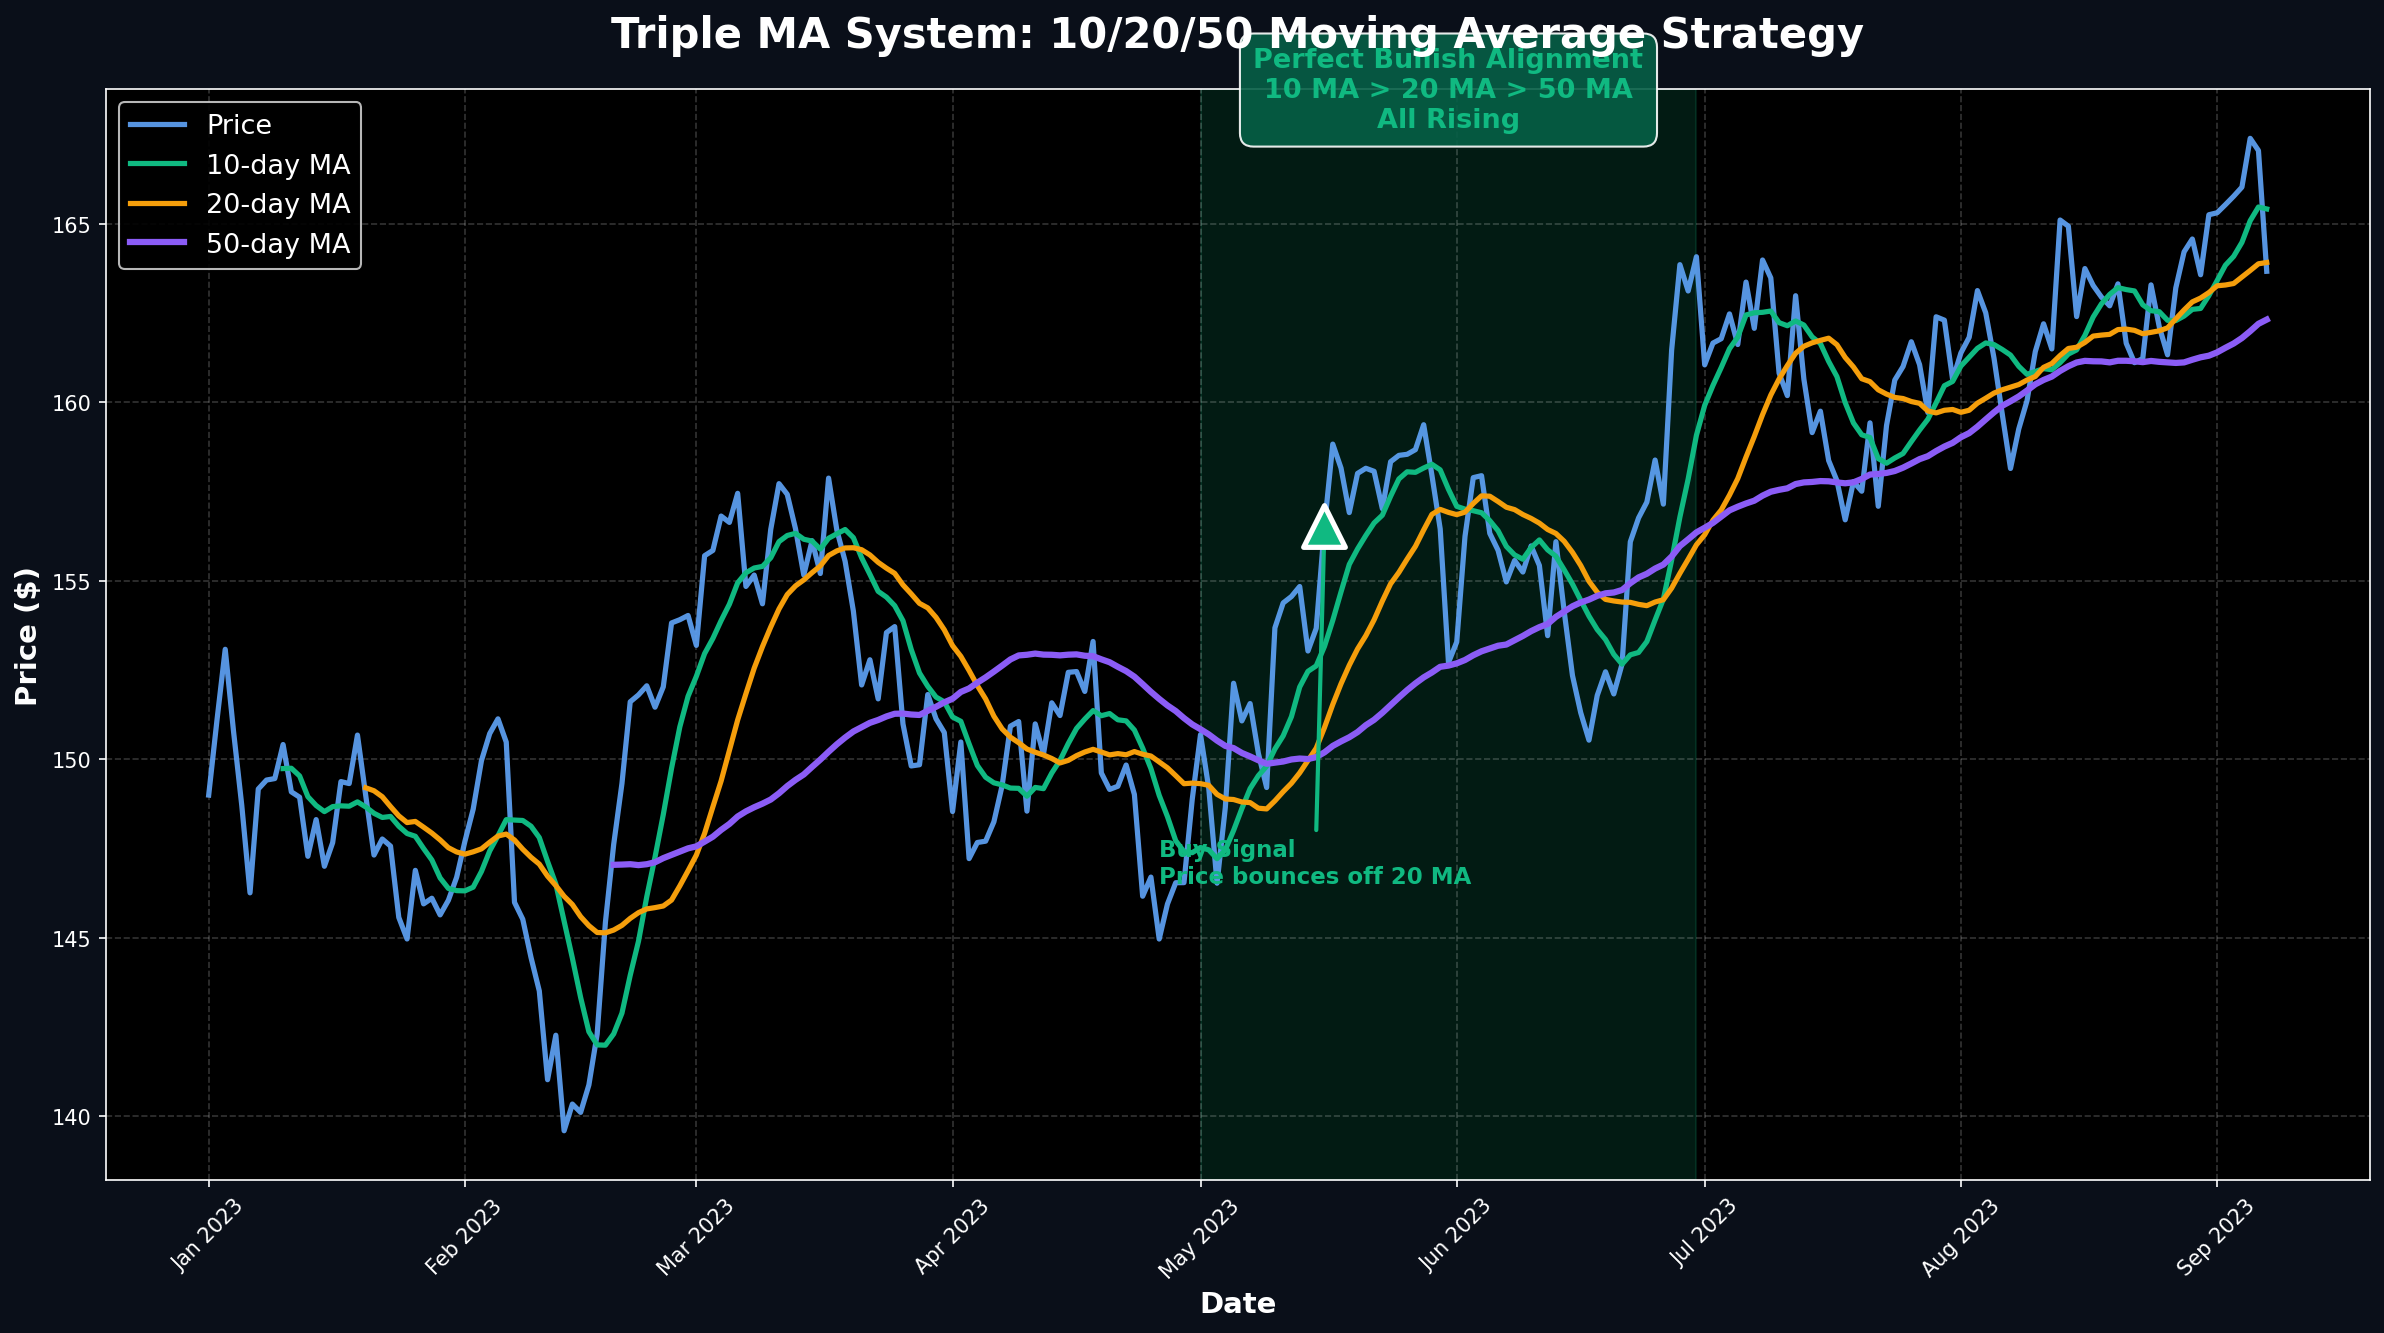
How the Triple MA System Works
- 10 MA: Fast MA for entries and exits
- 20 MA: Intermediate MA for pullback support
- 50 MA: Slow MA for trend direction
Perfect Bullish Alignment:
- ✓ Price > 10 MA > 20 MA > 50 MA
- ✓ All three MAs rising
- ✓ MAs separated (not compressed)
- ✓ Price respects 20 MA on pullbacks
Triple MA Trading Rules
Entry Signals:
- Aggressive: Buy when price bounces off 10 MA (in alignment)
- Conservative: Buy when price bounces off 20 MA (stronger support)
- Confirmation: 10 MA must be above 20 MA, both above 50 MA
Exit Signals:
- Early Warning: 10 MA crosses below 20 MA
- Exit Signal: Price closes below 20 MA
- Trend Change: 20 MA crosses below 50 MA
Real Example: NVDA Triple MA (2023)
NVIDIA's 2023 rally provided textbook triple MA setups:
- March: Perfect alignment at $240 → rallied to $320 (+33%)
- June: Pullback to 20 MA at $380 → rallied to $480 (+26%)
- September: Bounce off 20 MA at $420 → rallied to $500 (+19%)
Each pullback to the 20 MA with perfect alignment offered low-risk entries.
MA Ribbon Strategy
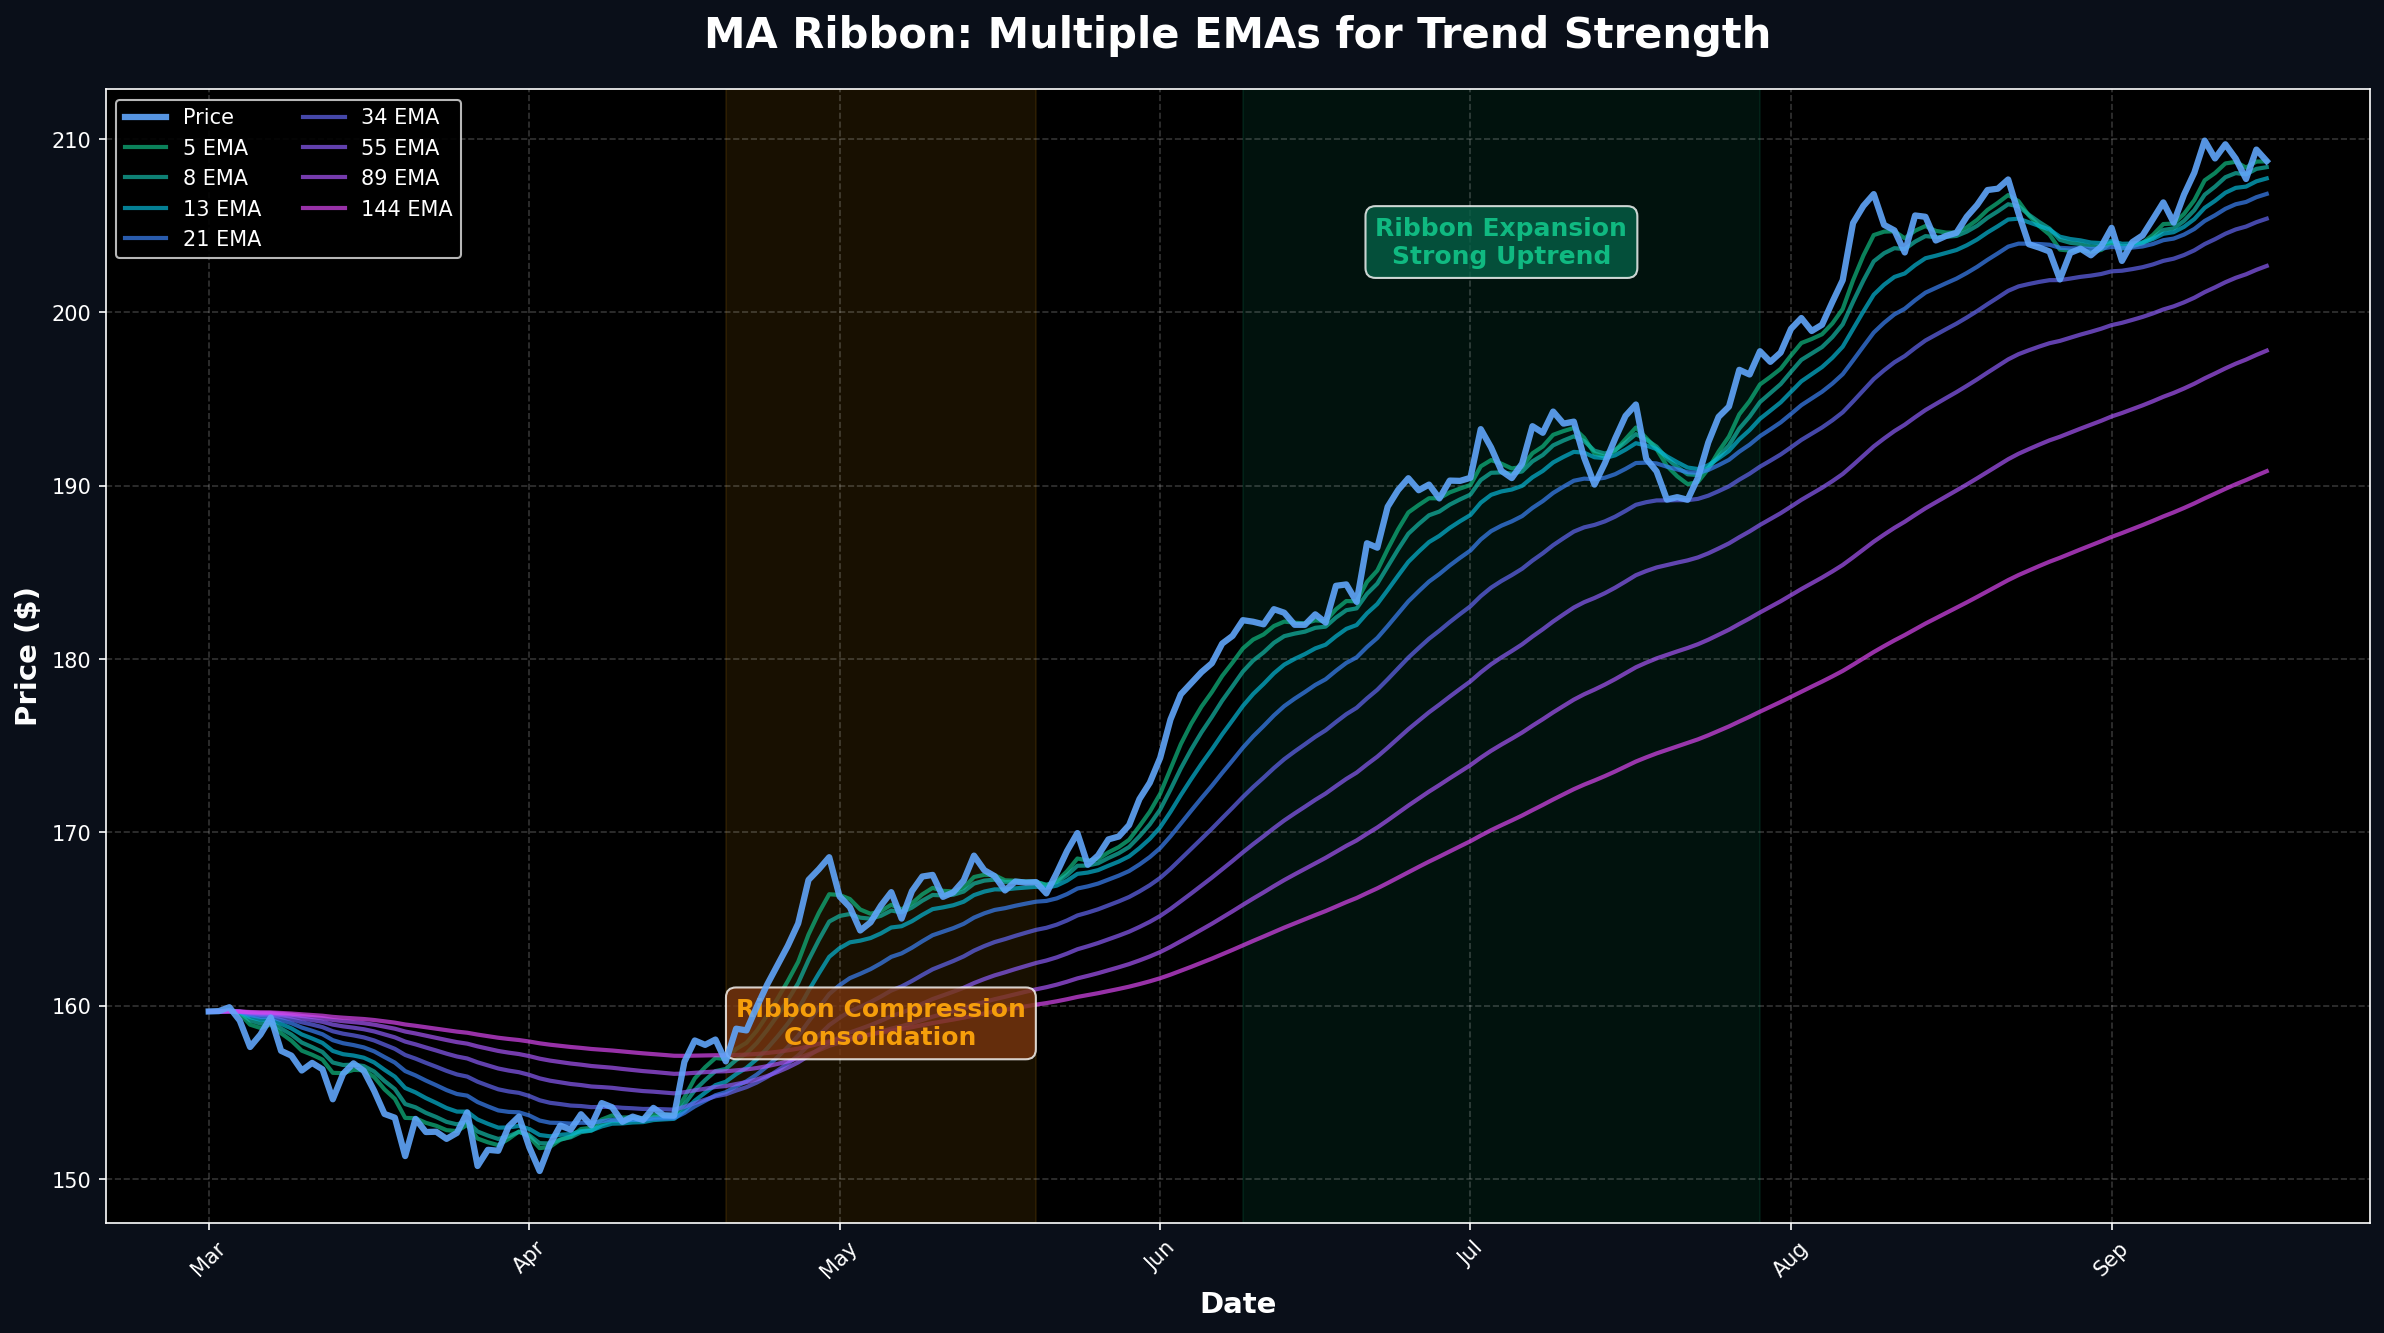
An MA ribbon uses 6-12 moving averages plotted together. The ribbon's width and slope reveal trend strength and potential reversals.
Common Ribbon Configurations
8-EMA Ribbon (Fibonacci):
5, 8, 13, 21, 34, 55, 89, 144
Uses Fibonacci numbers for natural market rhythm
6-SMA Ribbon (Linear):
10, 20, 30, 40, 50, 60
Evenly spaced for clear visual separation
Reading the Ribbon
- Ribbon Expansion: MAs spread apart = strong trend, stay in trade
- Ribbon Compression: MAs converge = consolidation, reduce position
- Ribbon Flip: MAs cross each other = trend reversal, exit
- Price Above Ribbon: All MAs below price = strong uptrend
- Price Below Ribbon: All MAs above price = strong downtrend
Ribbon Trading Strategy:
- Entry: Price pulls back to ribbon in uptrend, bounces
- Confirmation: Ribbon is expanding (not compressed)
- Stop Loss: Below the ribbon
- Exit: Ribbon starts compressing or flipping
Guppy Multiple Moving Average (GMMA)
Developed by Daryl Guppy, this system uses two groups of EMAs to show the relationship between traders (short-term) and investors (long-term).
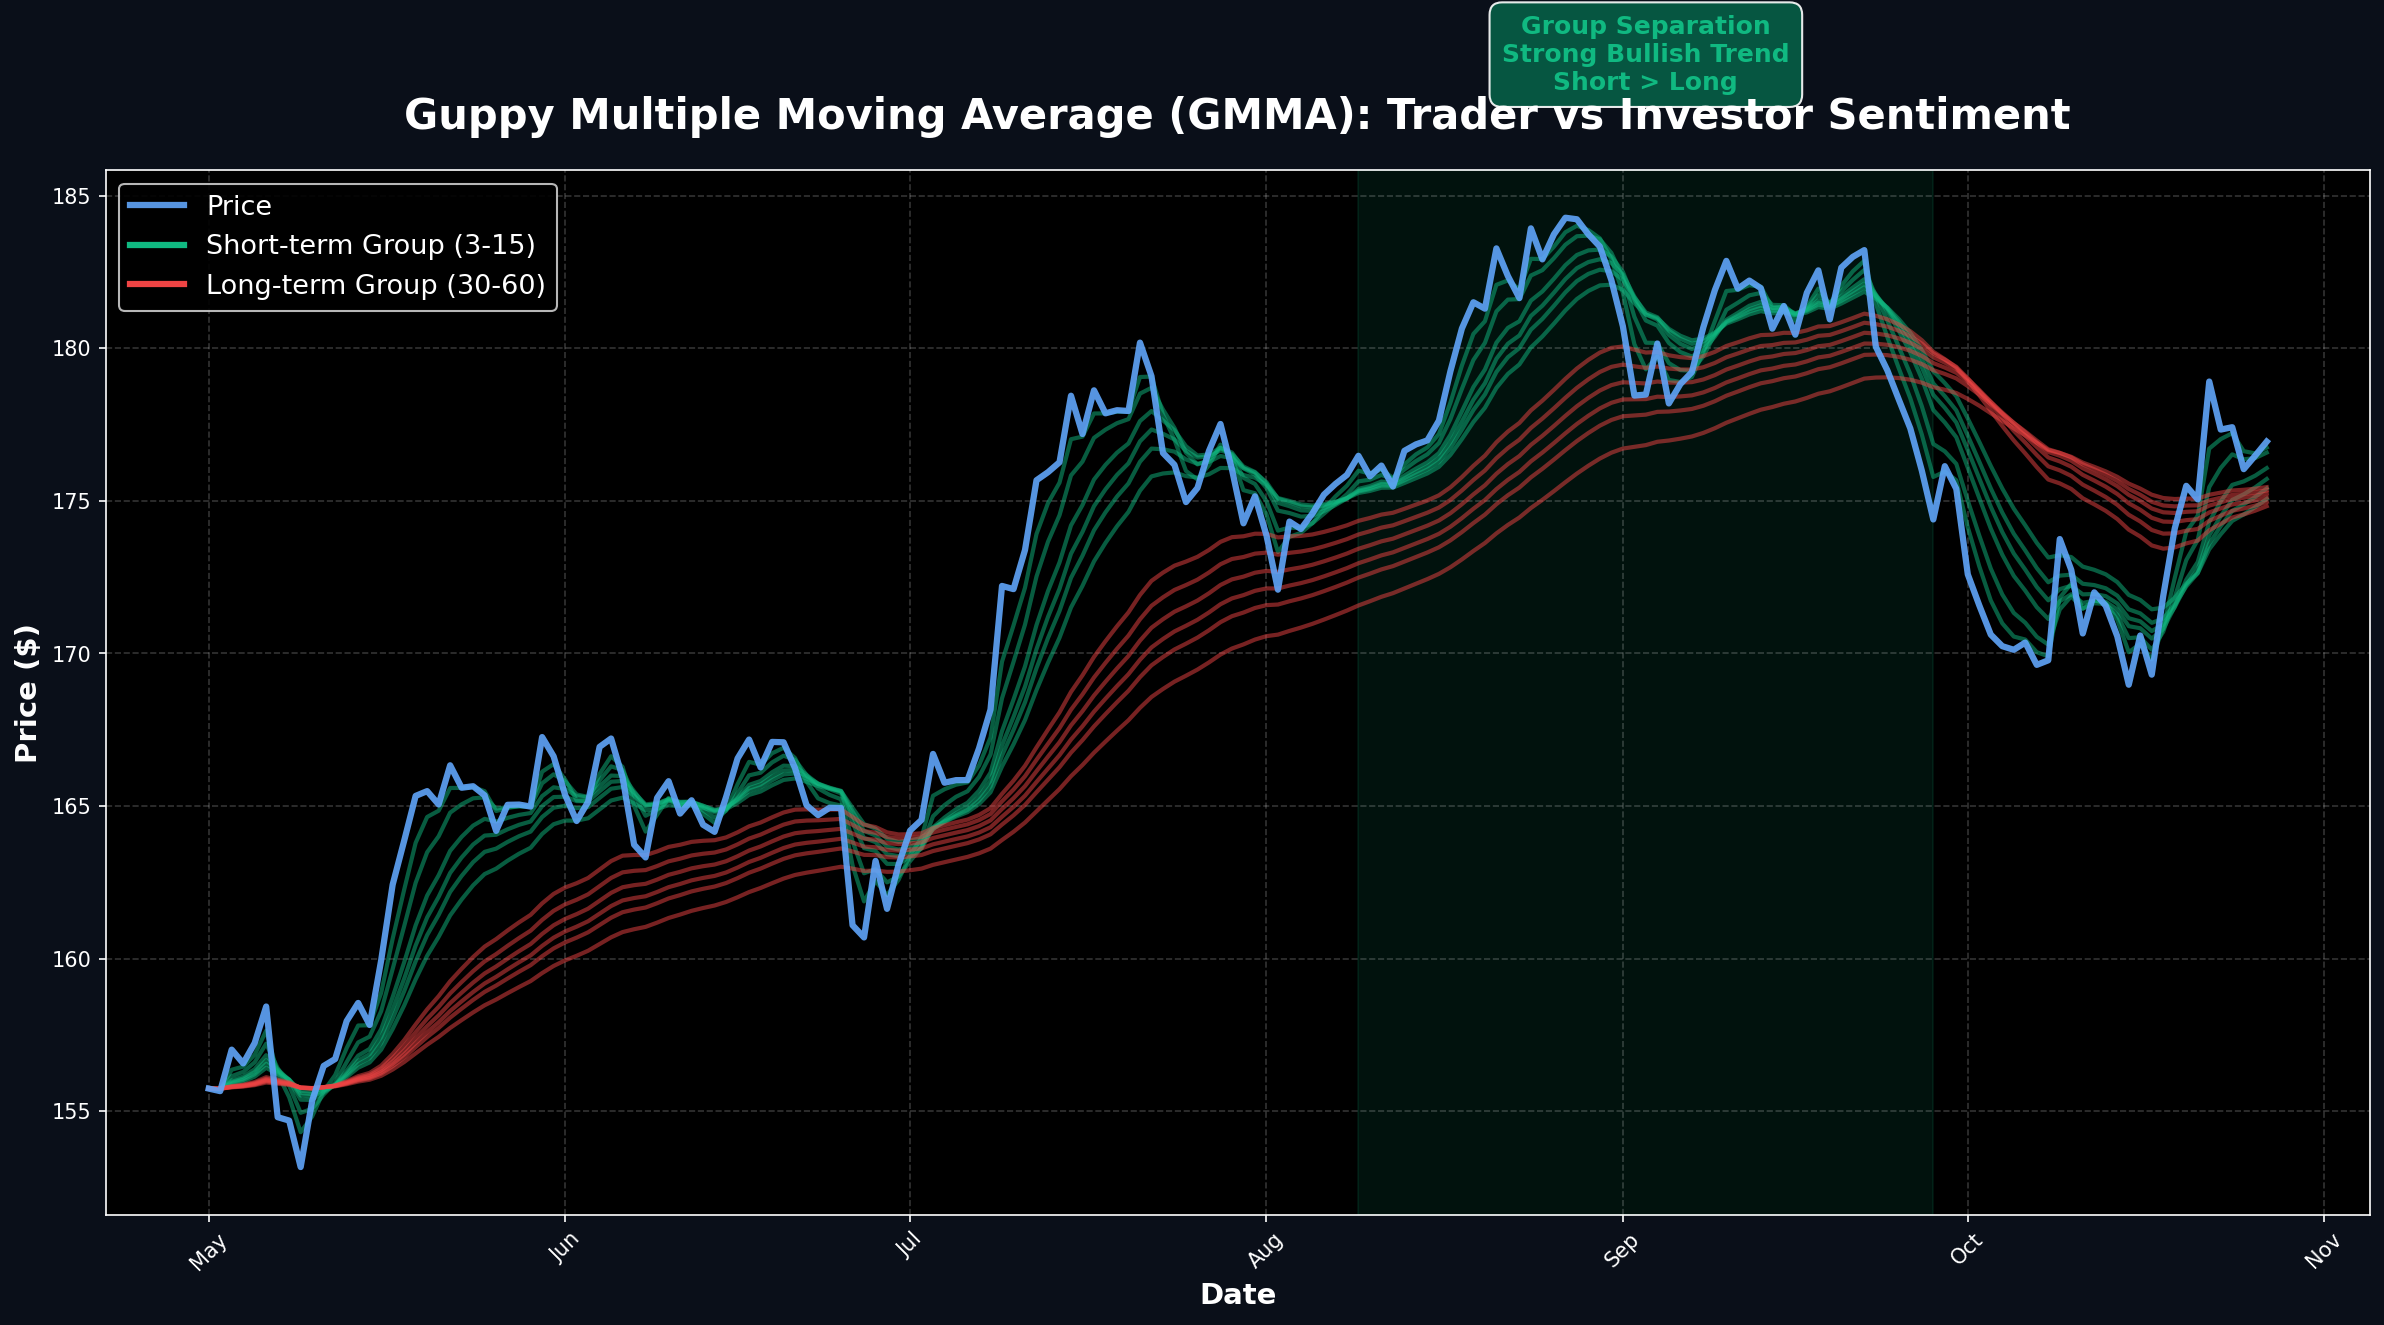
GMMA Structure
Short-term Group (Traders):
3, 5, 8, 10, 12, 15 EMAs
Represents short-term trader activity and sentiment
Long-term Group (Investors):
30, 35, 40, 45, 50, 60 EMAs
Represents long-term investor positioning
GMMA Signals
- Group Separation: Wide gap between groups = strong trend
- Group Compression: Groups converge = weak trend, consolidation
- Group Crossover: Short-term crosses long-term = trend change
- Agreement: Both groups rising = strong bullish consensus
- Disagreement: Groups moving opposite = uncertainty, avoid
GMMA Trading Rules:
- Buy Signal: Short-term group crosses above long-term group
- Hold: Groups remain separated and rising
- Warning: Groups start compressing
- Exit: Short-term group crosses below long-term group
MA Confluence Zones
When multiple MAs cluster at the same price level, they create powerful support or resistance zones. These confluence areas often mark major turning points.
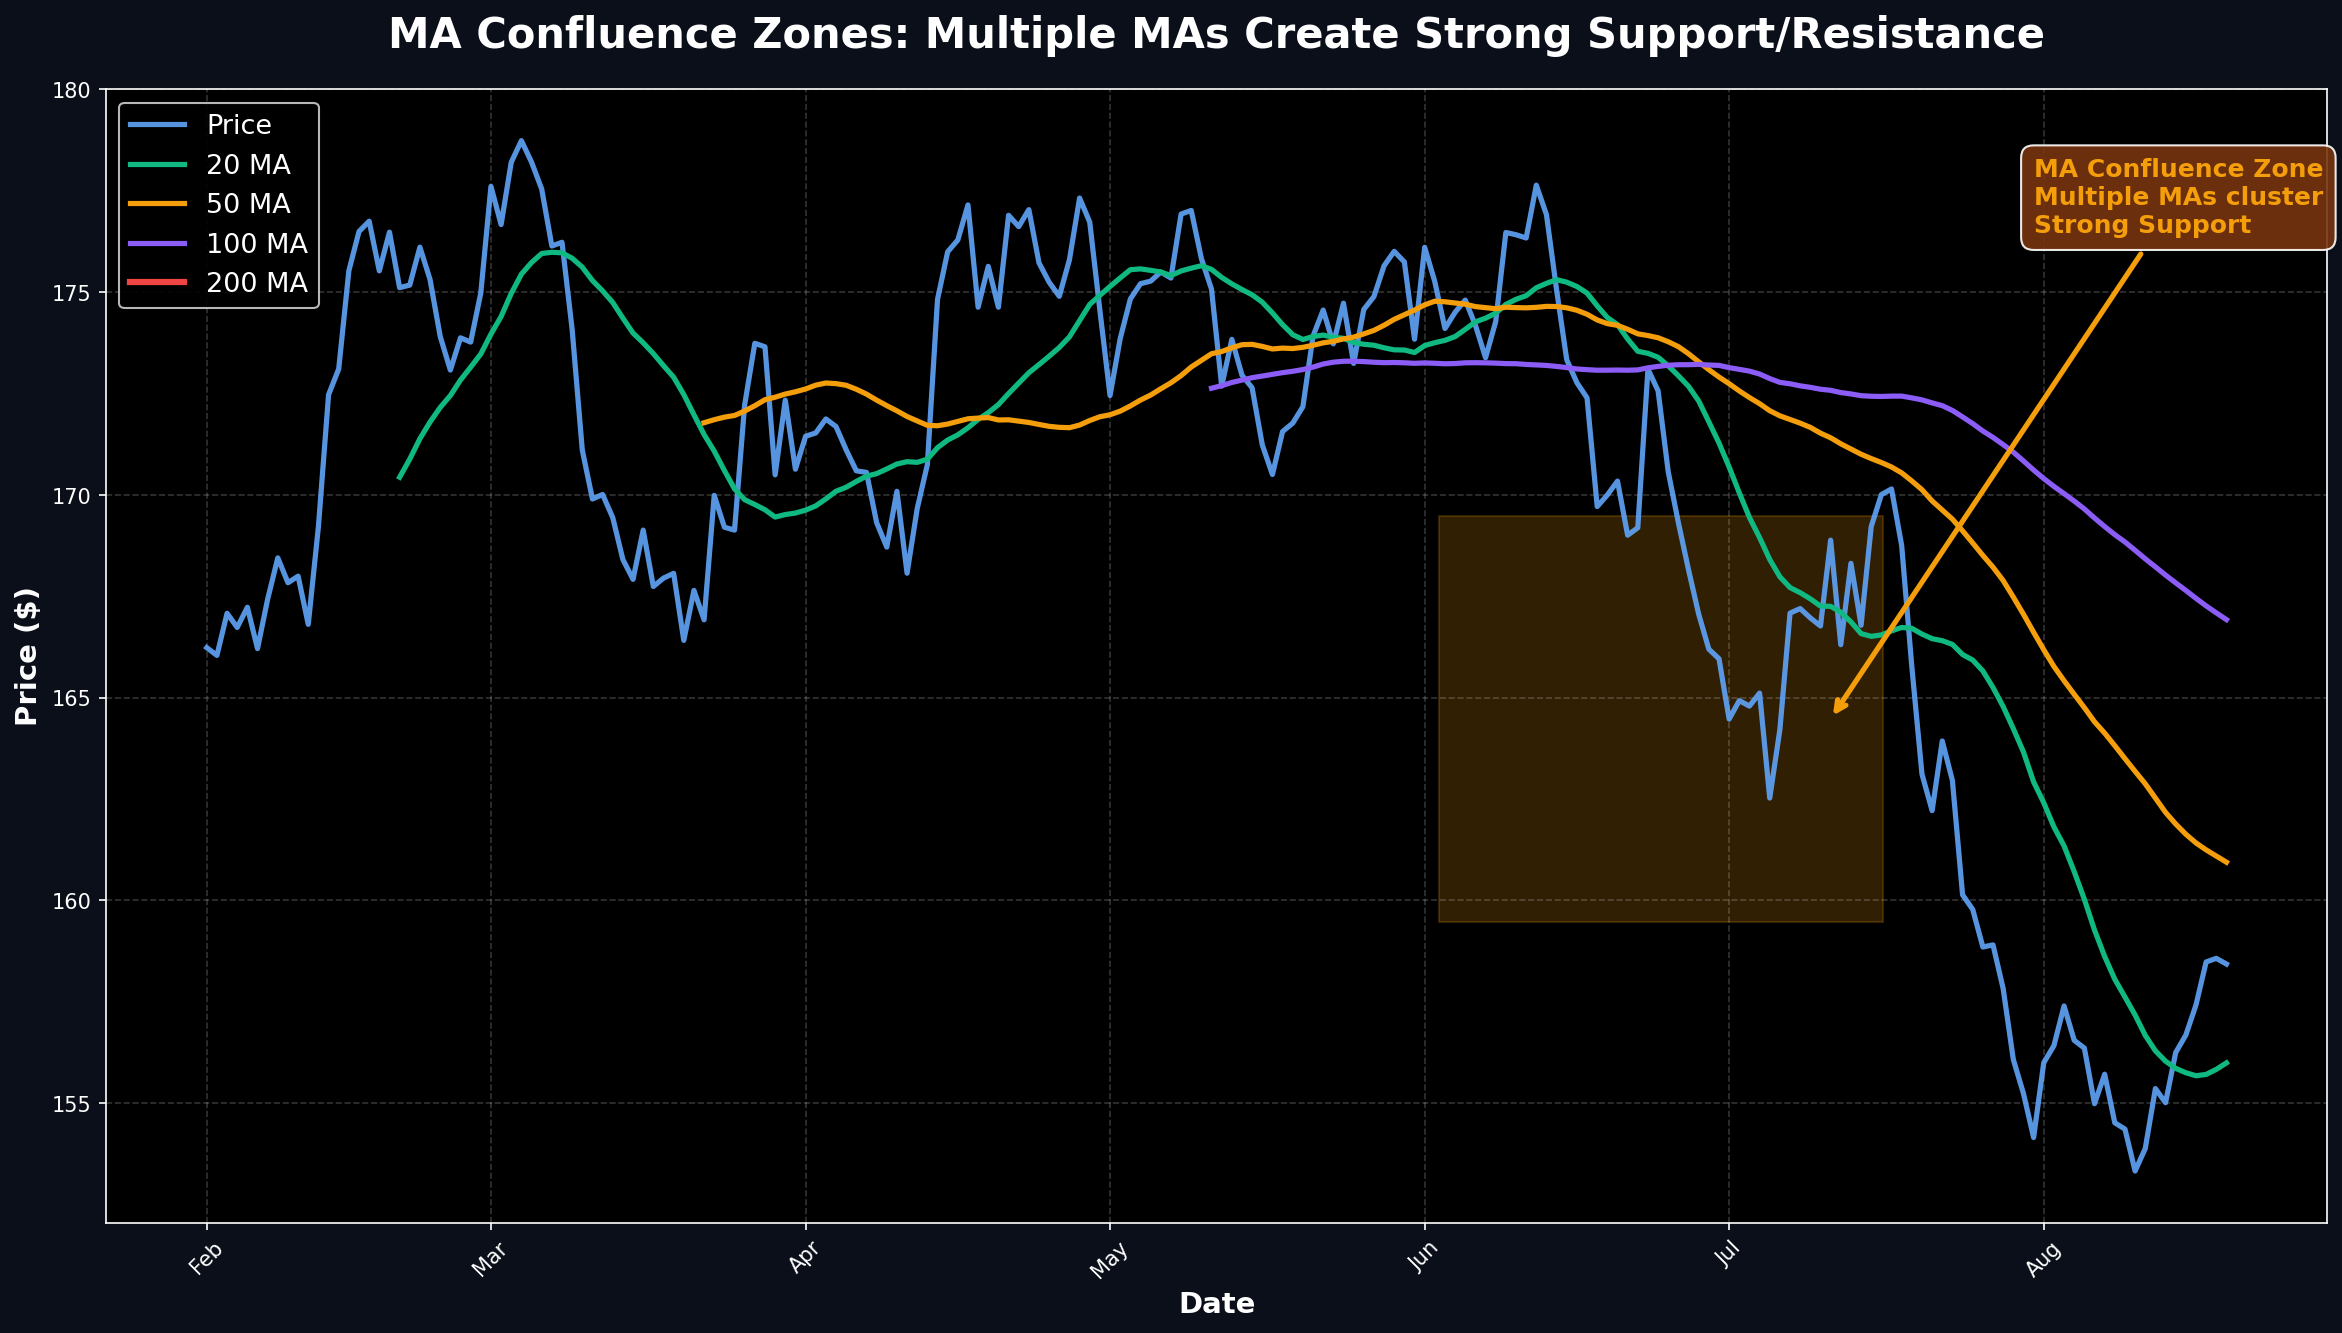
Identifying Confluence
Confluence occurs when 3+ MAs from different timeframes cluster within a tight price range (typically 1-2%).
Example Confluence Setup:
- 20 MA at $150.20
- 50 MA at $150.50
- 100 MA at $150.80
- 200 MA at $151.00
- Confluence Zone: $150-151 (0.7% range)
Trading Confluence Zones
- Support Confluence: Buy when price approaches from above
- Resistance Confluence: Sell or take profits when price approaches from below
- Breakout: Strong move through confluence = powerful signal
- Failed Break: Rejection at confluence = reversal opportunity
Filtering False Signals
Multiple MA systems excel at filtering out noise and false signals that plague single MA strategies.
Filter #1: MA Alignment
Only trade when all MAs are aligned in the same direction. If 10 MA > 20 MA but 20 MA < 50 MA, the trend is unclear—wait.
Filter #2: MA Slope
All MAs should be sloping in the signal direction. Flat or counter-sloping MAs indicate weak trends.
Filter #3: MA Separation
MAs should be separated, not compressed. Compressed MAs = choppy market, high risk of whipsaws.
Filter #4: Price Position
For longs, price should be above all MAs. For shorts, below all MAs. Price between MAs = no trade zone.
Complete Filter Checklist:
- ☐ All MAs aligned (10 > 20 > 50 for bullish)
- ☐ All MAs sloping in signal direction
- ☐ MAs separated (not compressed)
- ☐ Price above all MAs (for longs)
- ☐ Volume confirms the move
Advanced Multi-MA Techniques
1. The Staircase Pattern
In strong trends, price "walks up the stairs" of MAs—bouncing from 10 MA to 20 MA to 50 MA in sequence. Each bounce offers an entry.
2. The Compression Breakout
When MAs compress tightly, a breakout is imminent. Trade the direction of the breakout with tight stops.
3. The MA Fan
MAs spreading out like a fan indicate accelerating momentum. Stay in the trade until the fan starts closing.
4. The MA Sandwich
Price trapped between two MA groups (e.g., above 10/20 but below 50/100) = consolidation. Wait for breakout.
Position Sizing with Multiple MAs
Use MA alignment to adjust position size:
Position Sizing Rules:
- Perfect Alignment: Full position (2% risk)
- Partial Alignment: Half position (1% risk)
- No Alignment: No trade (0% risk)
- Compression: Reduce position by 50%
Common Mistakes to Avoid
❌ Mistake #1: Too Many MAs
More isn't always better. Beyond 8-10 MAs, you're just adding noise. Stick to 3-8 MAs maximum.
❌ Mistake #2: Ignoring Alignment
Trading when MAs are misaligned leads to whipsaws. Wait for proper alignment before entering.
❌ Mistake #3: Trading Compression
Compressed MAs = choppy market. Reduce position size or stay out until MAs separate.
Backtesting Results
Studies of multiple MA systems on S&P 500 stocks (2015-2023):
Triple MA System (10/20/50):
- Win Rate: 71% (with alignment filter)
- Average Gain: +9.8% per trade
- Average Loss: -3.2% per trade
- Profit Factor: 2.8:1
MA Ribbon (8 EMAs):
- Win Rate: 68% (ribbon expansion trades)
- Average Gain: +12.4% per trade
- Average Loss: -4.1% per trade
- Best Performance: Strong trending markets
Practical Trading Plan
Here's a complete multiple MA system you can implement:
10/20/50 Triple MA System:
- Setup: 10 MA > 20 MA > 50 MA, all rising
- Entry: Price bounces off 20 MA with volume
- Stop Loss: Below 50 MA or recent swing low
- Target 1: Previous high (take 50%)
- Target 2: Trail stop at 20 MA (let 50% run)
- Exit: 10 MA crosses below 20 MA
Key Takeaways
- ✓ Multiple MAs provide confirmation that single MAs can't
- ✓ Triple MA (10/20/50) balances responsiveness and reliability
- ✓ MA ribbons show trend strength through expansion/compression
- ✓ Guppy GMMA reveals trader vs investor sentiment
- ✓ MA confluence zones create powerful support/resistance
- ✓ Alignment is critical—only trade when MAs agree
- ✓ Separation indicates strength—compression signals weakness
- ✓ Use MAs as filters to reduce false signals
Next Steps
Ready to implement multiple MA systems? Start by:
- 1. Adding 10/20/50 MAs to your charts
- 2. Practicing alignment identification on historical charts
- 3. Paper trading the triple MA system for 20 trades
- 4. Experimenting with ribbon and Guppy systems
📚 Continue Learning
Explore our other moving average guides:
Ready to Put This Into Practice?
Join MarketDly to access real-time market insights, AI-powered analysis, and professional trading tools.
No credit card required • Free tier available • Upgrade anytime