Moving Average Price Action: MAs + Candlesticks + Volume
Moving averages become exponentially more powerful when combined with price action analysis. By reading candlestick patterns at MA levels and confirming with volume, you can identify high-probability setups that single indicators miss. This is how professional traders use MAs—not in isolation, but as part of a complete price action system.
💡 Why Price Action Matters
MAs tell you WHERE to look for trades. Price action tells you WHEN to enter. Volume tells you IF the move is real. Together, they create a complete trading system with clear entry and exit rules.
MAs as Dynamic Support and Resistance
Unlike static horizontal support/resistance, moving averages adjust to price action, creating dynamic levels that move with the trend.
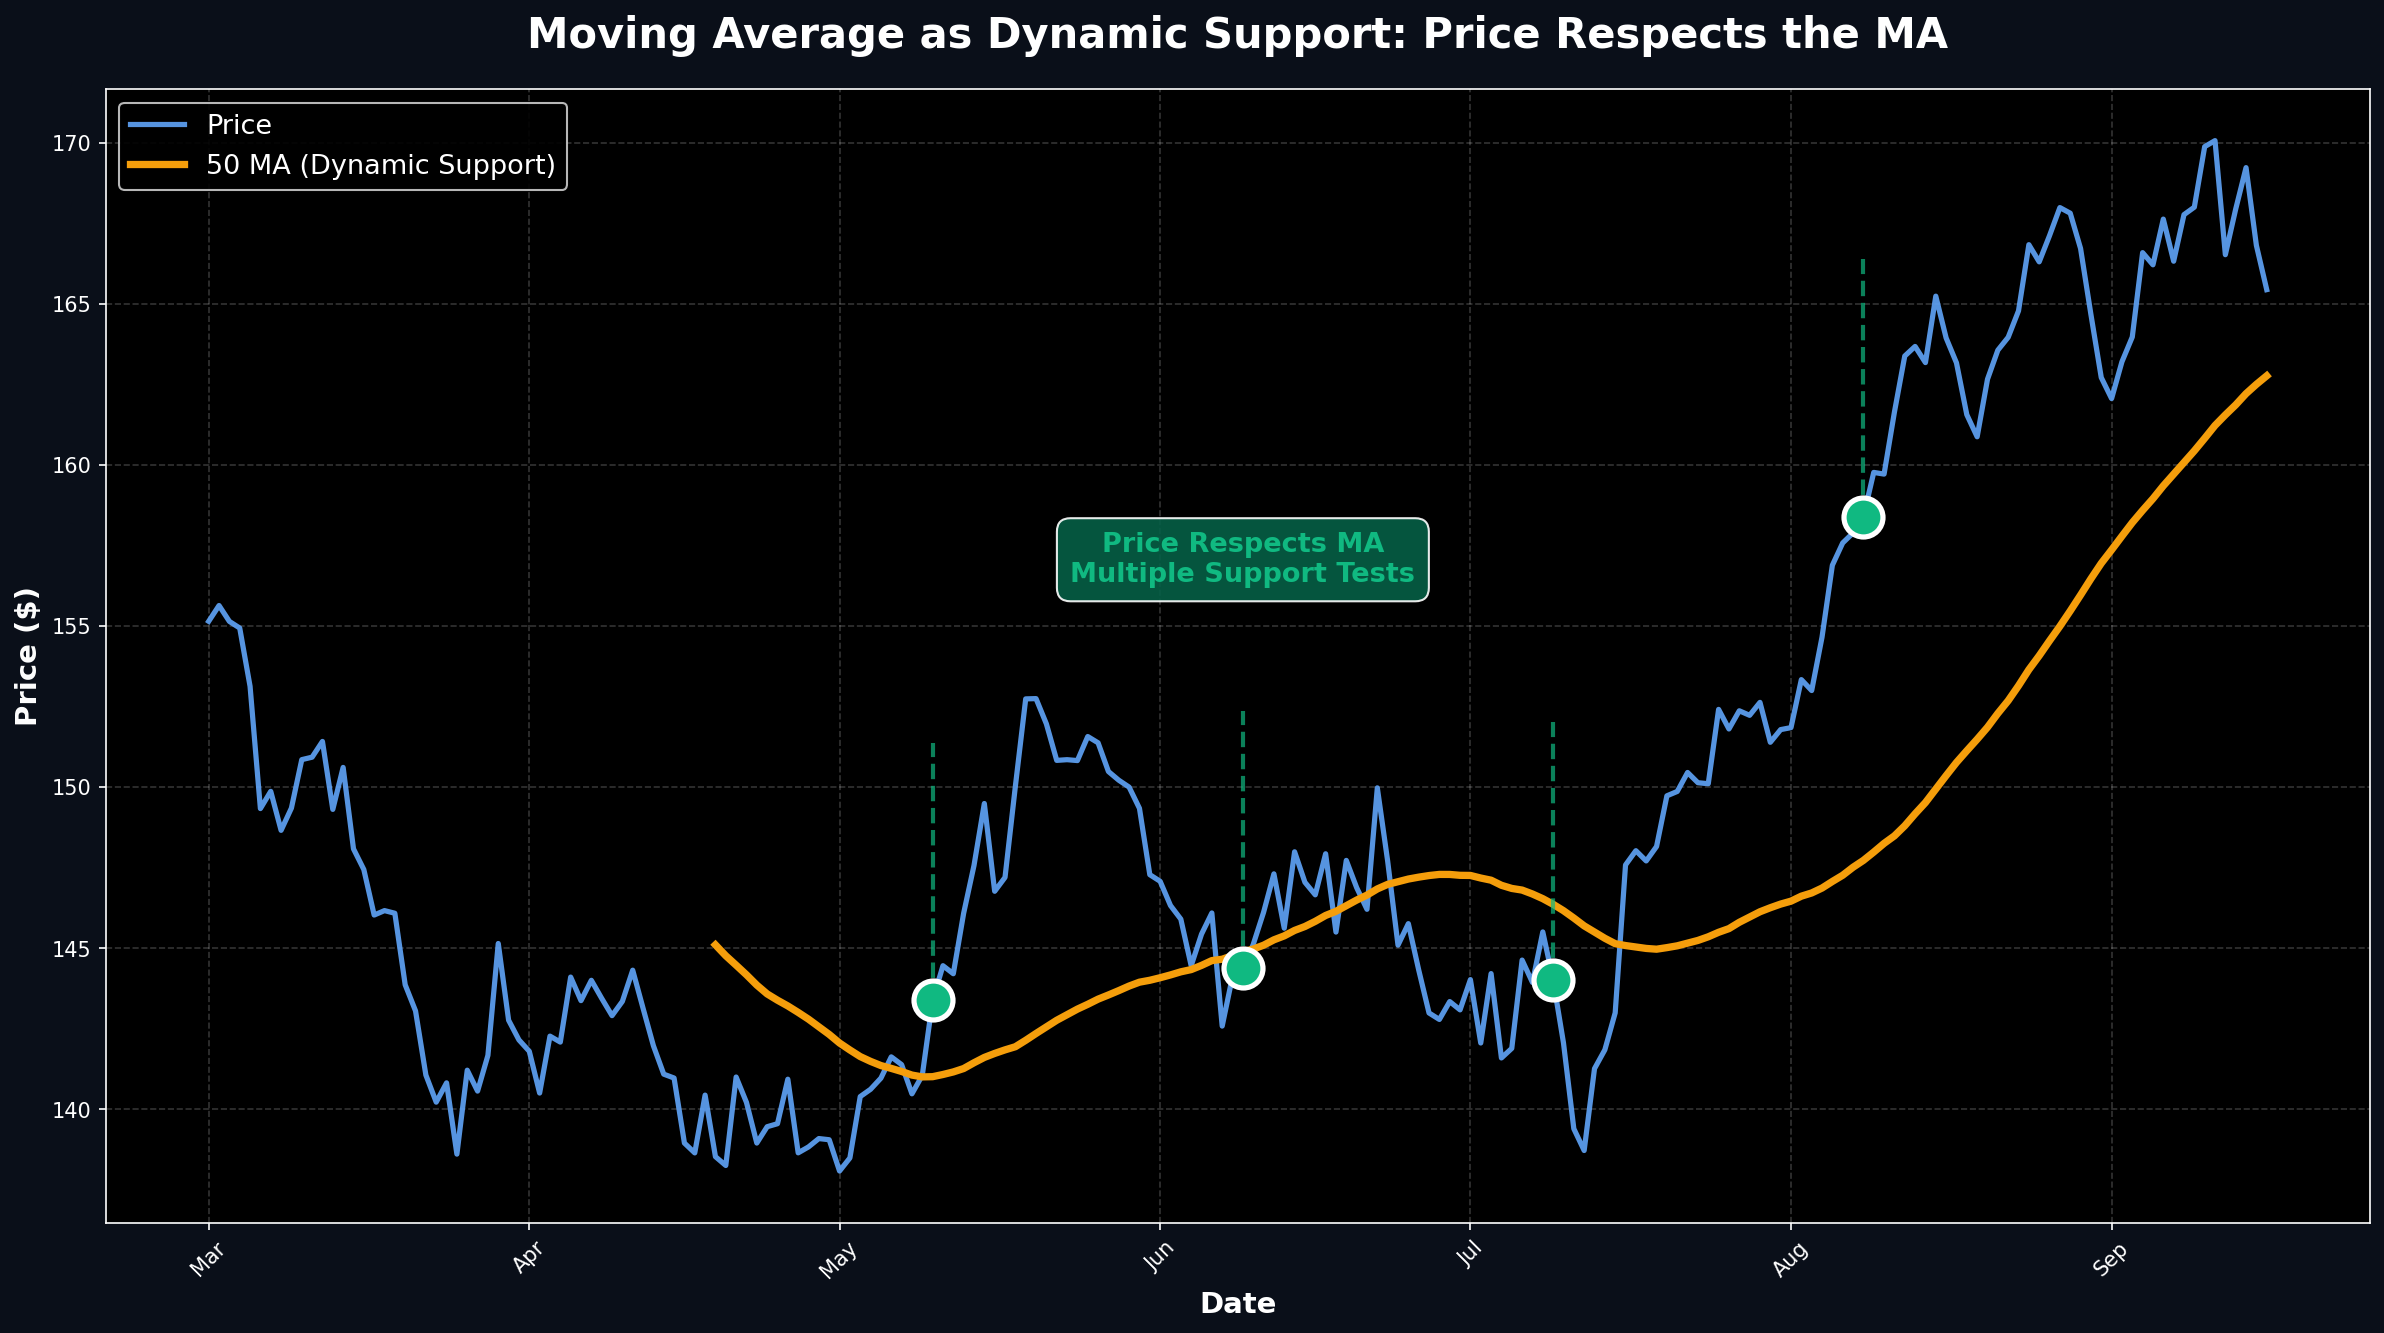
Why Dynamic Levels Work Better
- Adapt to trends: MAs slope with price, staying relevant
- Self-fulfilling: Millions watch the same MAs, creating real support
- Clear invalidation: Break below MA = trend change
- Multiple timeframes: Different MAs for different holding periods
Reading MA Support Strength:
- First touch: Strongest support, highest probability
- Second touch: Still strong, but watch for break
- Third+ touch: Weakening, support may fail
- Clean bounce: Price respects MA precisely = strong
- Messy bounce: Price chops through MA = weak
Candlestick Patterns at MA Levels
Candlestick patterns gain significance when they form at key MA levels. A hammer at the 50 MA is far more powerful than a hammer in empty space.
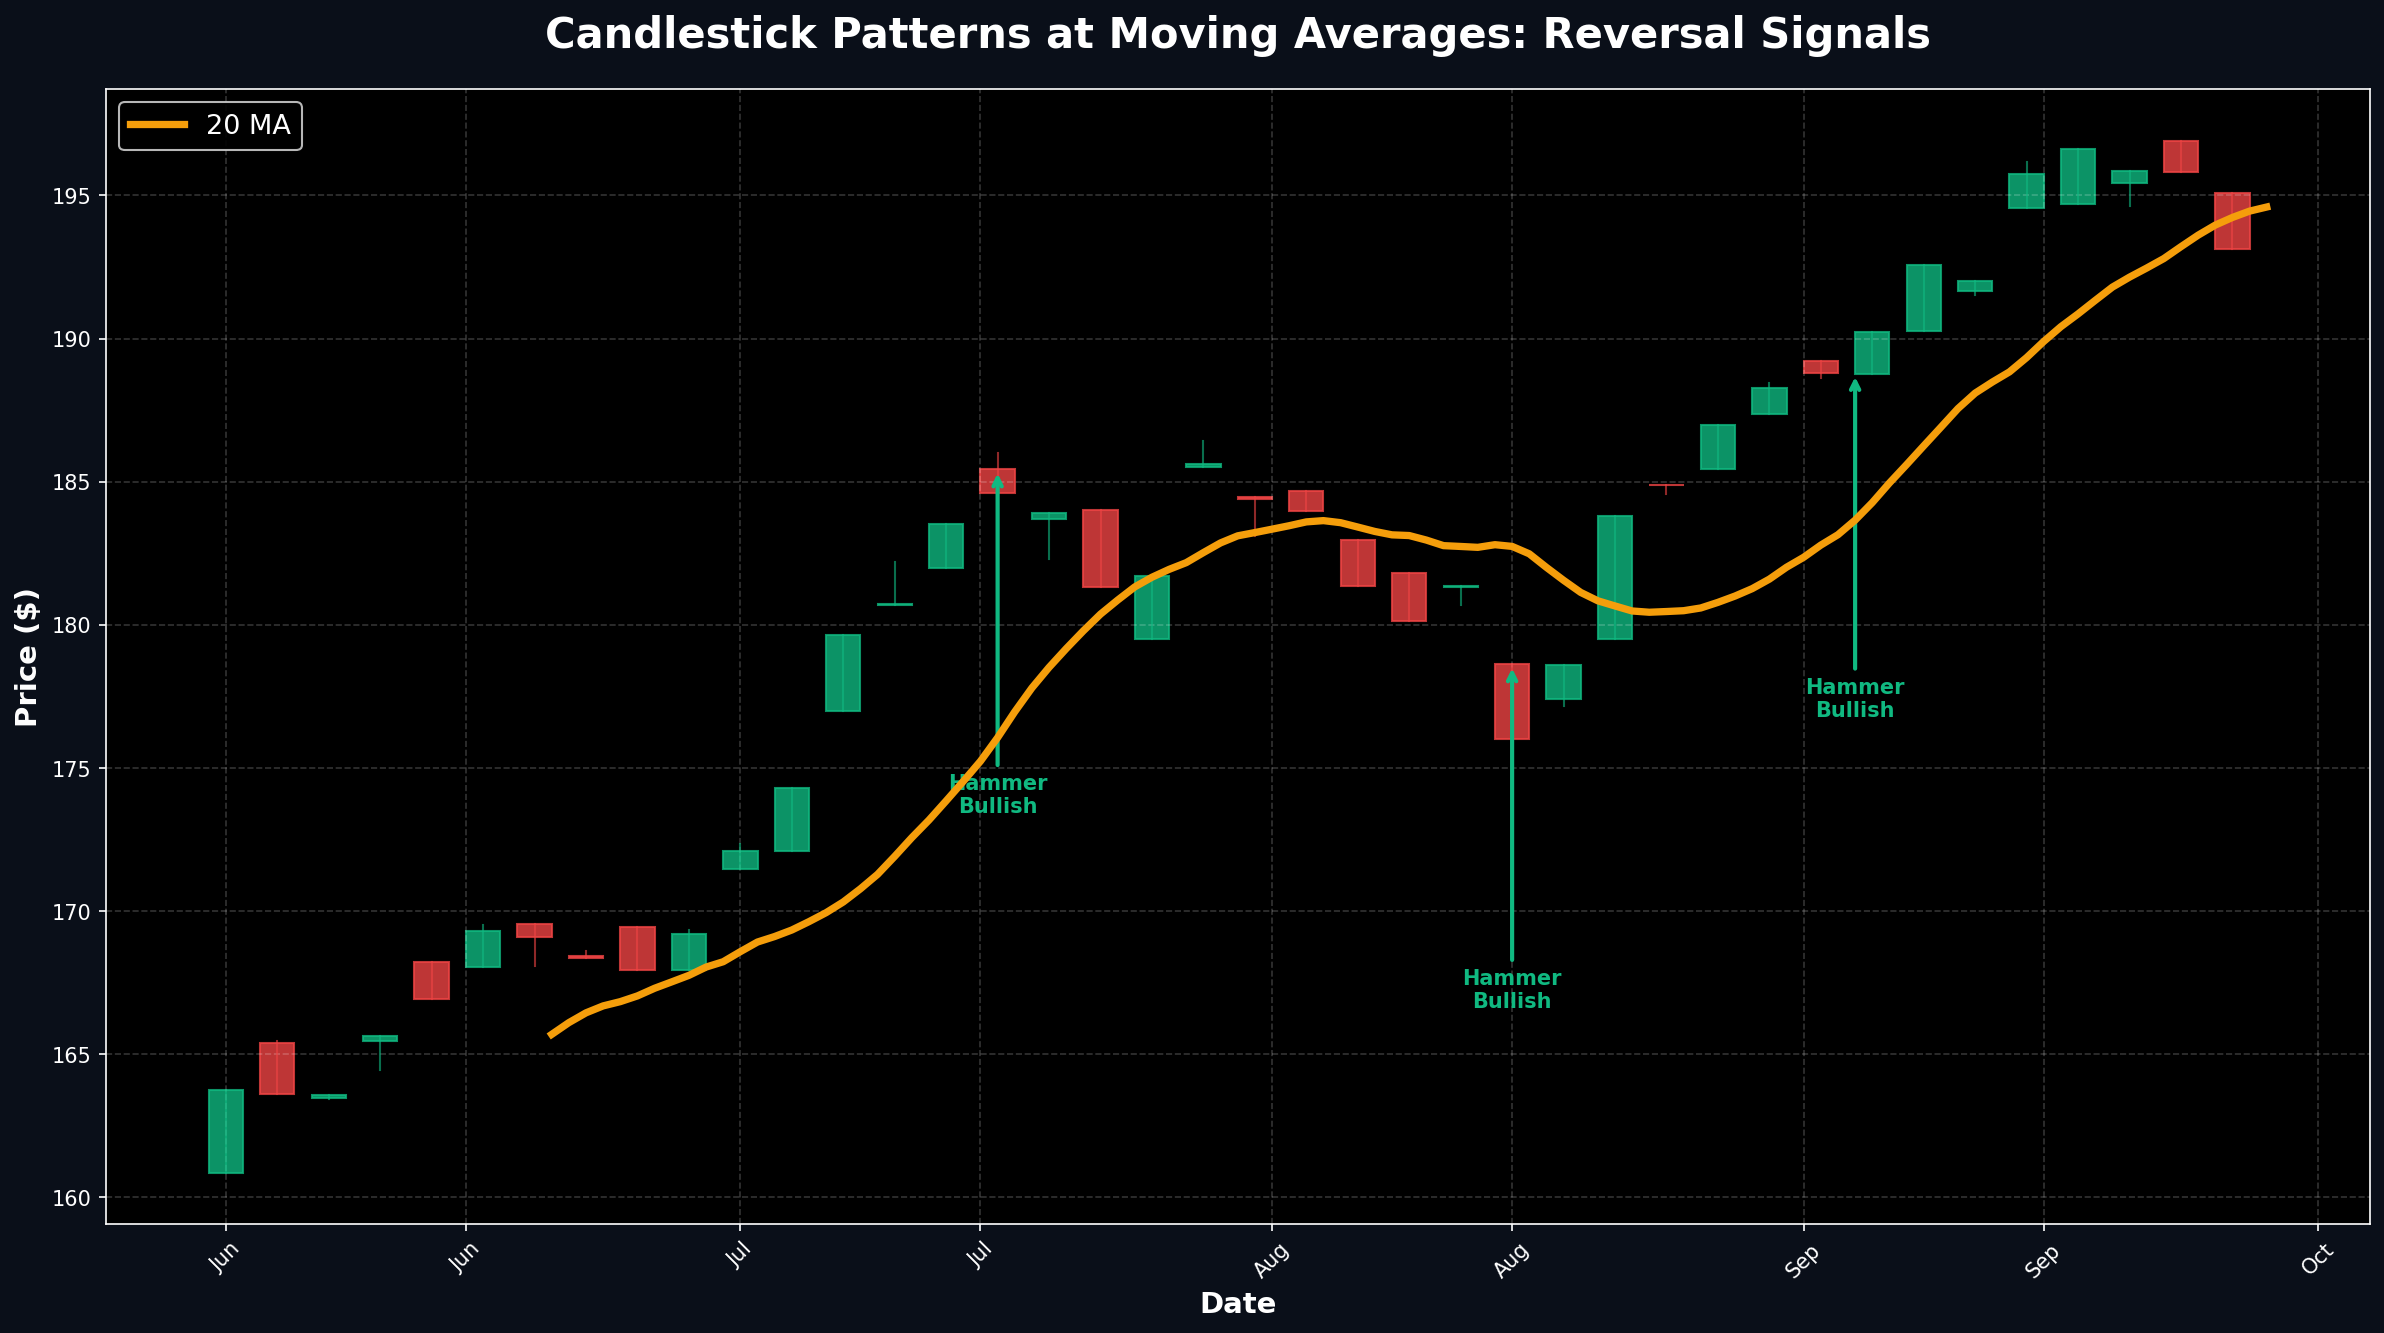
Bullish Patterns at MA Support
High-Probability Bullish Setups:
- Hammer at MA: Long lower wick shows rejection, buyers stepped in
- Bullish engulfing at MA: Strong reversal, previous sellers overwhelmed
- Morning star at MA: Three-candle reversal, high reliability
- Doji at MA: Indecision, wait for next candle confirmation
- Piercing pattern at MA: Buyers taking control
Bearish Patterns at MA Resistance
High-Probability Bearish Setups:
- Shooting star at MA: Long upper wick shows rejection at resistance
- Bearish engulfing at MA: Sellers overwhelm buyers
- Evening star at MA: Three-candle top, strong reversal
- Dark cloud cover at MA: Bearish reversal pattern
- Hanging man at MA: Warning of potential reversal
Real Example: AAPL Hammer at 50 MA (2023)
Apple formed a perfect hammer at its rising 50 MA on May 15, 2023:
- Setup: Price pulled back to 50 MA at $172
- Pattern: Hammer with 2:1 lower wick to body ratio
- Volume: 40% above average on the hammer day
- Result: Rallied to $185 over next 3 weeks (+7.6%)
Price Rejection Patterns
The most powerful MA signals come from rejection—when price tests an MA and immediately reverses. Long wicks are your friend.
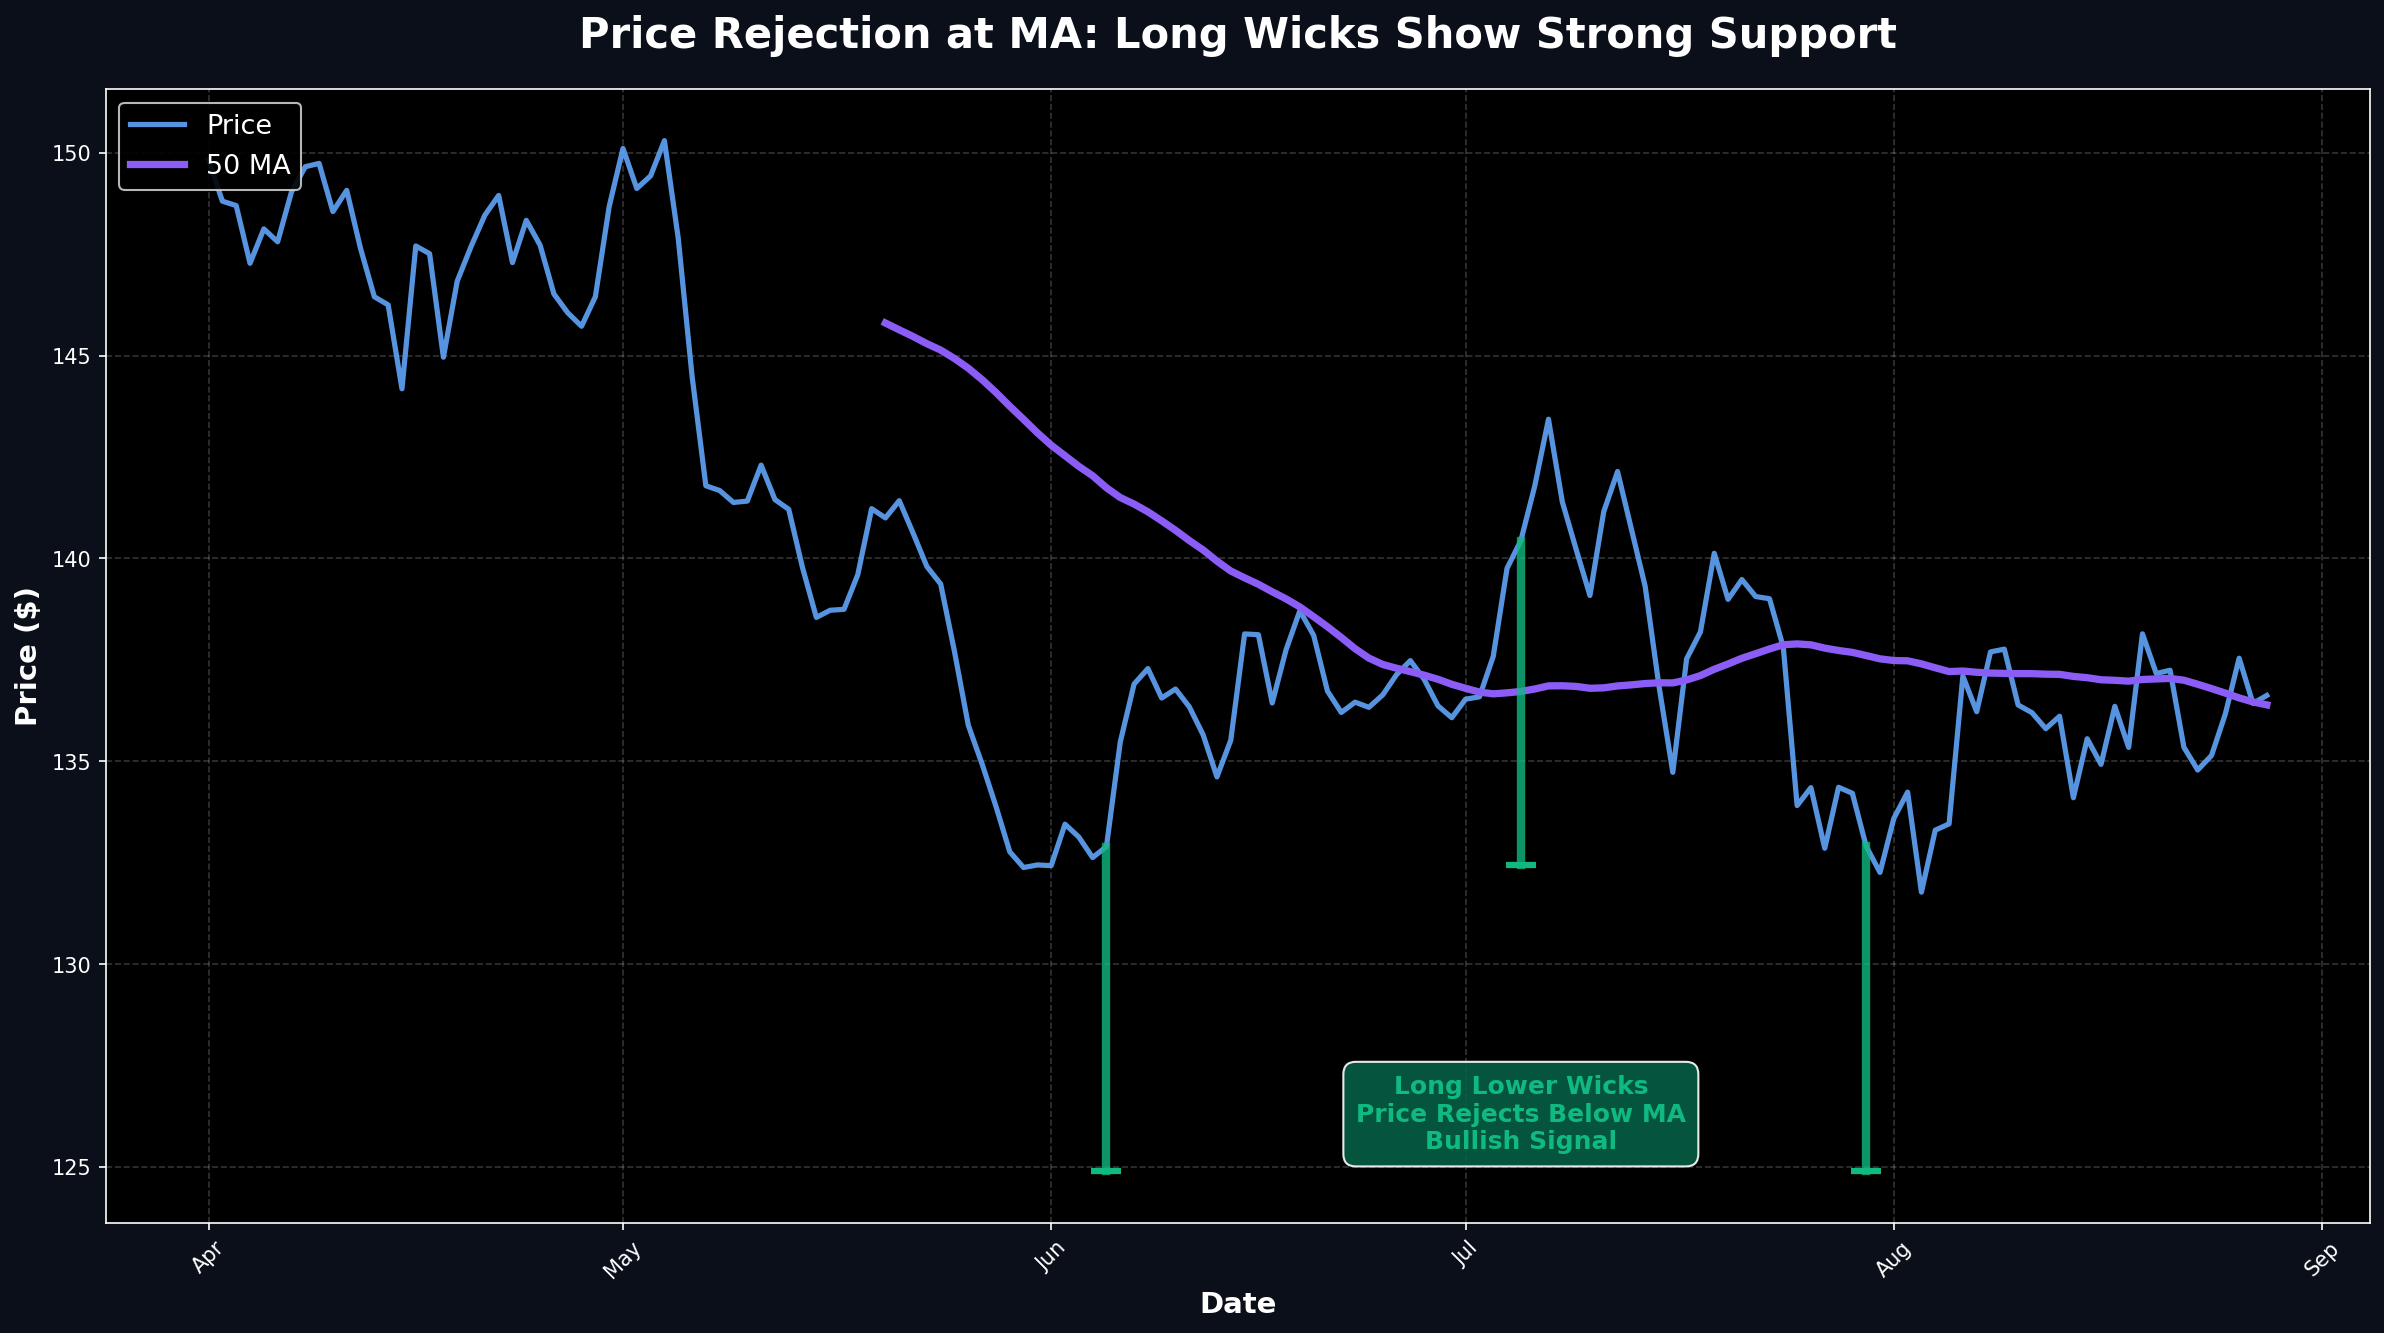
Reading Rejection Wicks
- Long lower wick at MA: Buyers defended the level aggressively
- Long upper wick at MA: Sellers rejected the breakout attempt
- Wick length matters: Longer wick = stronger rejection
- Body position: Close near high (bullish) or low (bearish)
Wick-to-Body Ratios:
- 2:1 ratio: Good rejection, tradeable
- 3:1 ratio: Strong rejection, high probability
- 4:1+ ratio: Extreme rejection, very strong signal
- Small body: Indecision, less reliable
The Pin Bar Setup
A pin bar (long wick, small body) at an MA is one of the highest-probability setups in trading:
Pin Bar Trading Rules:
- Entry: On close of pin bar or next candle open
- Stop Loss: Below pin bar low (bullish) or above high (bearish)
- Target: 2-3x the pin bar range
- Confirmation: Pin bar closes in top 1/3 (bullish)
Volume Confirmation
Volume validates price action at MAs. High volume bounces are reliable. Low volume bounces often fail.
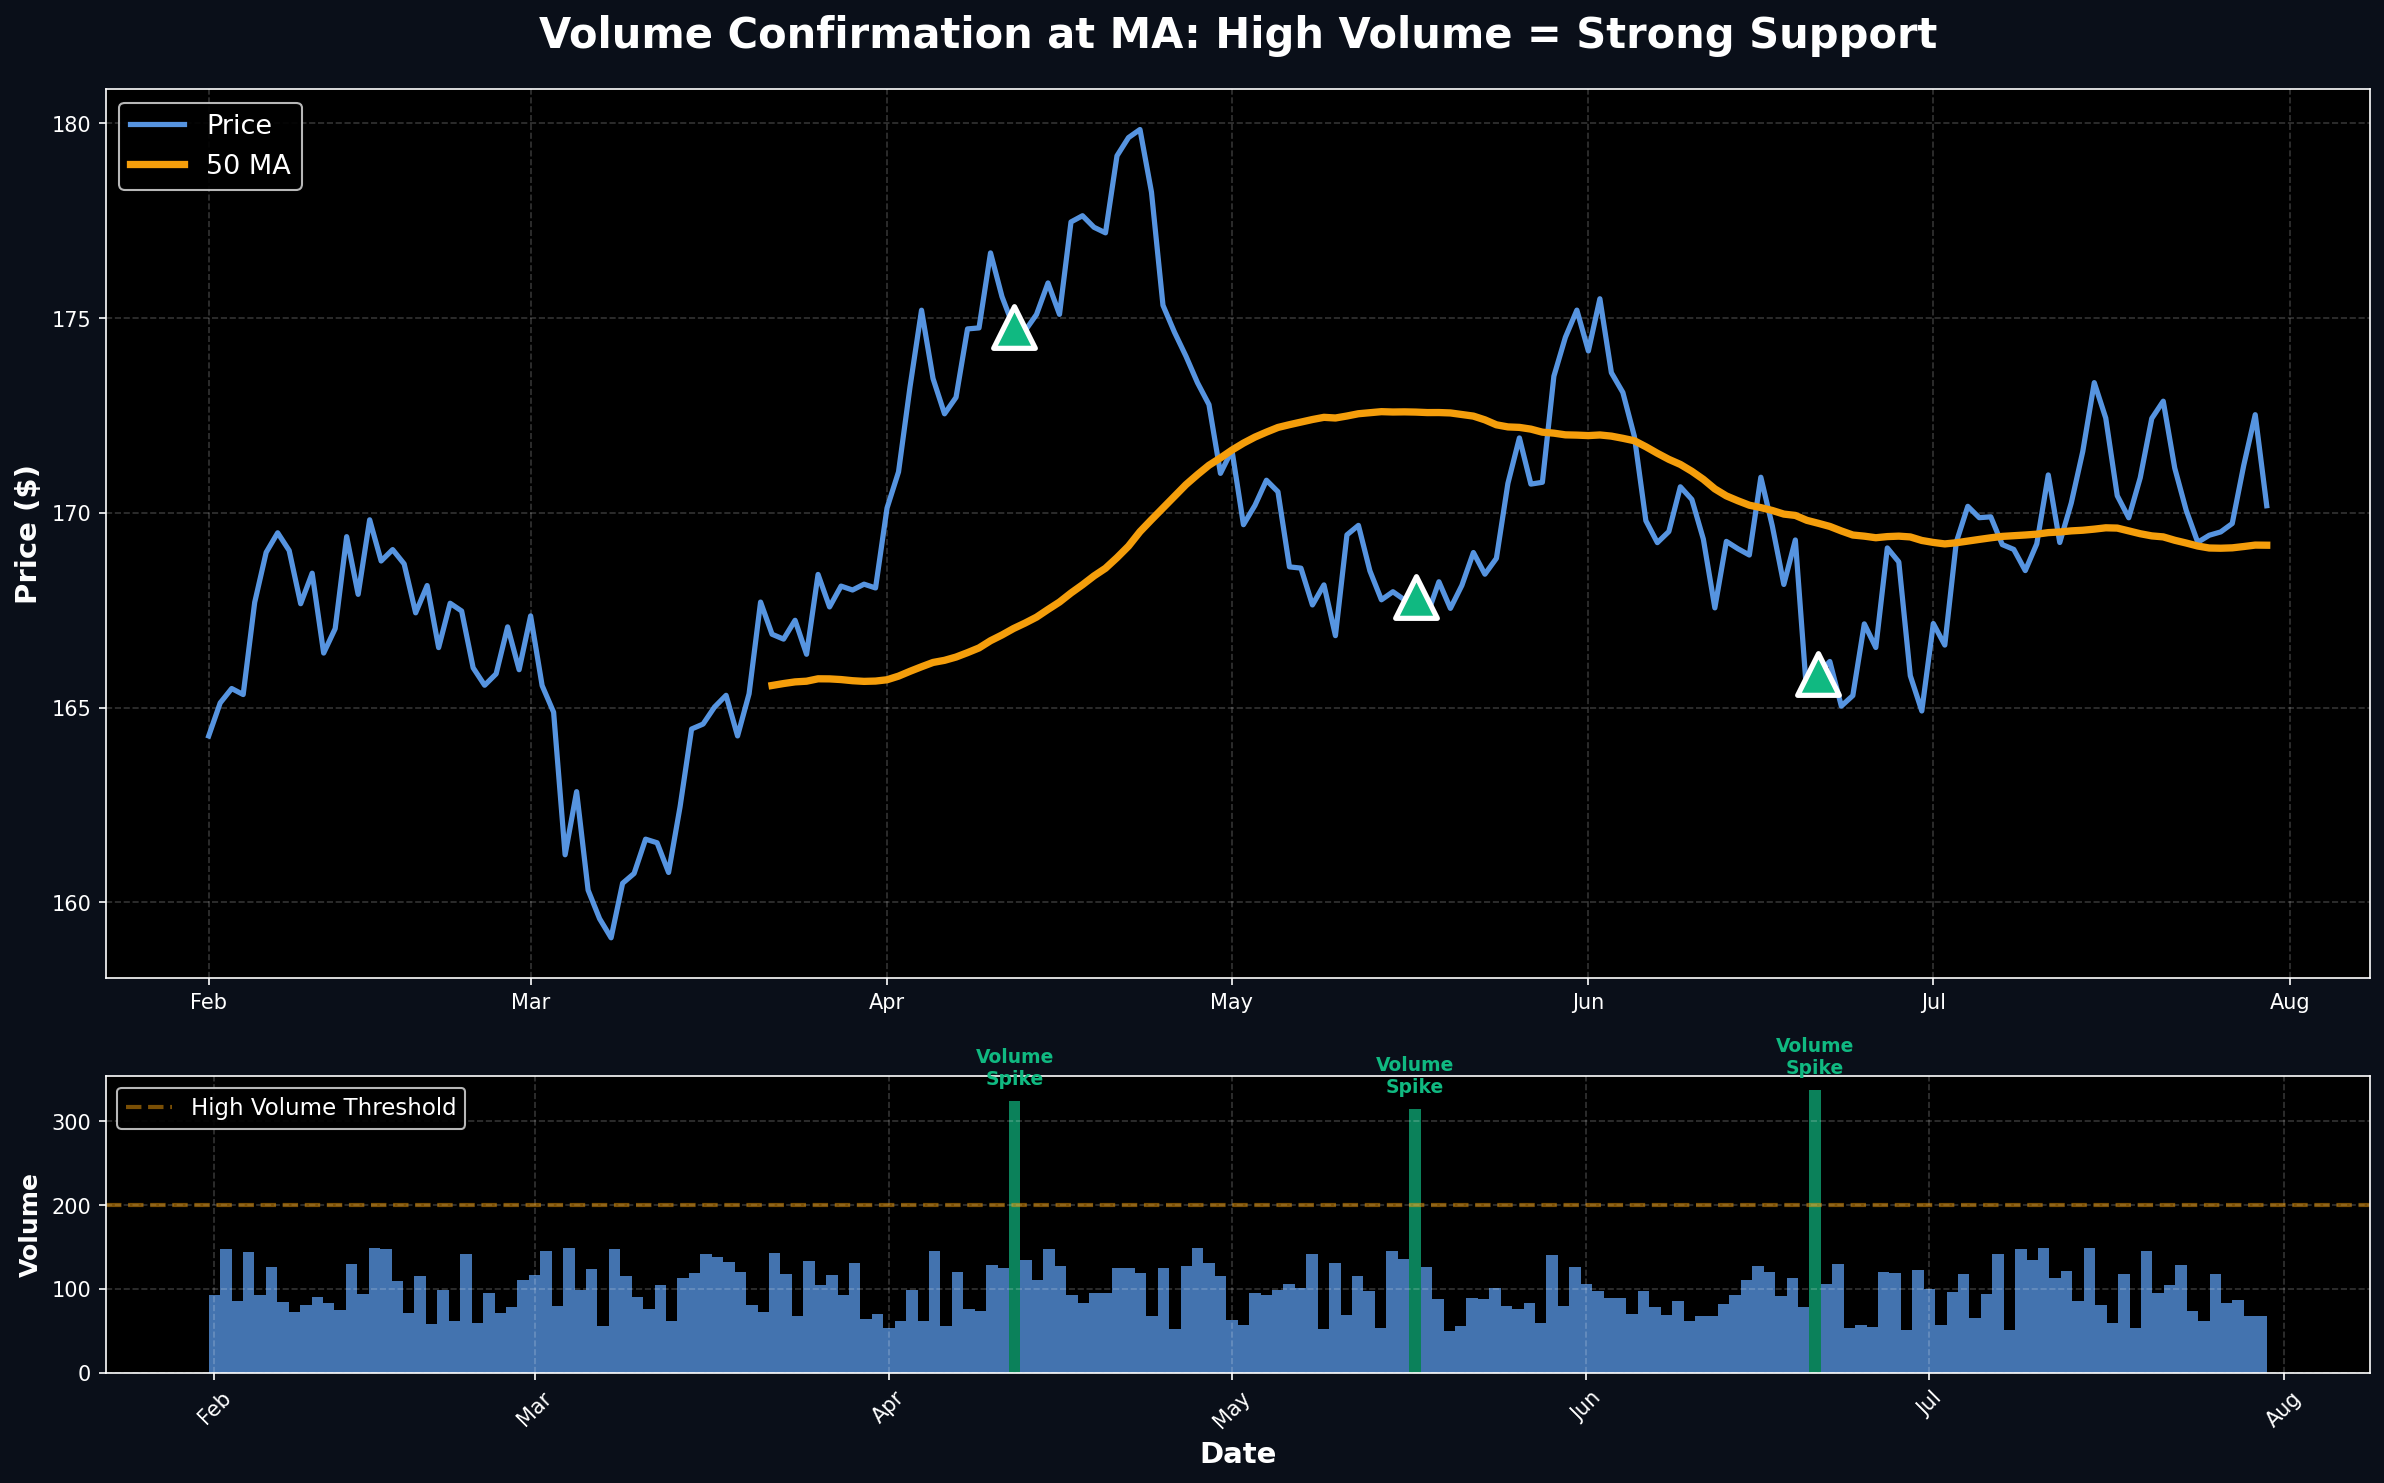
Volume Analysis at MAs
Volume Signals:
- High volume bounce: Strong support, buyers committed
- Low volume bounce: Weak support, likely to fail
- Volume spike on break: Trend change confirmed
- Declining volume into MA: Weak test, good for bounce
- Climax volume at MA: Potential reversal point
Volume Thresholds
Compare current volume to recent average:
- 150%+ of average: High volume, strong signal
- 100-150% of average: Normal volume, moderate signal
- Below 100%: Low volume, weak signal
- 50% or less: Very low volume, ignore the signal
Complete MA Price Action System
Here's how to combine all elements into a complete trading system:
The Perfect Setup Checklist:
- ☐ Price approaches rising MA (50 or 200)
- ☐ Bullish candlestick pattern forms (hammer, engulfing)
- ☐ Long lower wick shows rejection
- ☐ Volume 150%+ of average
- ☐ MA slope is rising (not flat)
- ☐ First or second touch of MA
- ☐ Higher timeframe confirms uptrend
Entry Timing
- Aggressive: Enter on close of reversal candle
- Conservative: Wait for next candle to confirm (close above MA)
- Very conservative: Wait for price to break above reversal candle high
Stop Loss Placement
- Tight: Below reversal candle low
- Standard: Below MA by 1-2%
- Wide: Below recent swing low
Advanced Price Action Techniques
1. The Failed Break
When price breaks below an MA but quickly reverses back above, it's a powerful buy signal. Failed breaks trap sellers and trigger short covering.
Failed Break Setup:
- Signal: Price closes below MA, then closes back above within 1-3 days
- Entry: On close back above MA
- Stop: Below the failed break low
- Target: Previous high or 2R
2. The Squeeze and Release
Price consolidates tightly around an MA, then explodes in one direction. The longer the squeeze, the bigger the move.
3. The Walk Away
After touching an MA, price immediately moves away without retesting. This shows strong momentum and often leads to extended moves.
4. The Overshoot and Snap Back
Price overshoots the MA significantly (5-10%), then snaps back. This creates a "rubber band" effect for mean reversion trades.
Multiple Timeframe Price Action
Check price action on multiple timeframes for confirmation:
Timeframe Alignment:
- Daily chart: Identifies the trend and key MA levels
- 4-hour chart: Finds entry patterns at daily MA levels
- 1-hour chart: Times precise entry on reversal candle
- Best setup: All three timeframes show bullish price action
Real Trading Examples
Example 1: TSLA Bullish Engulfing at 50 MA
Tesla, June 2023:
- Setup: Pullback to rising 50 MA at $245
- Pattern: Bullish engulfing candle
- Volume: 2x average volume
- Entry: $248 on engulfing close
- Stop: $240 (below MA)
- Result: Rallied to $275 in 2 weeks (+10.9%)
Example 2: MSFT Pin Bar at 200 MA
Microsoft, March 2023:
- Setup: First touch of 200 MA at $280
- Pattern: Pin bar with 4:1 wick-to-body ratio
- Volume: 180% of average
- Entry: $283 on next day open
- Stop: $276 (below pin bar low)
- Result: Rallied to $310 in 6 weeks (+9.5%)
Common Mistakes to Avoid
❌ Mistake #1: Ignoring Volume
A perfect candlestick pattern at an MA means nothing without volume confirmation. Always check volume.
❌ Mistake #2: Trading Against the Trend
Don't buy at MA resistance in a downtrend. Only trade MA bounces in the direction of the trend.
❌ Mistake #3: No Stop Loss
Price action setups can fail. Always use stops. A close below the MA invalidates the setup.
Key Takeaways
- ✓ MAs are dynamic support/resistance that adapt to trends
- ✓ Candlestick patterns at MAs are far more powerful than in isolation
- ✓ Long wicks show rejection—the longer the wick, the stronger the signal
- ✓ Volume confirms price action—high volume = reliable signal
- ✓ First MA touch is strongest—probability decreases with each test
- ✓ Failed breaks are powerful—they trap traders and trigger reversals
- ✓ Multiple timeframes improve accuracy—check daily, 4H, and 1H
- ✓ Always trade with the trend—buy MA support in uptrends only
Next Steps
Ready to trade MA price action? Start by:
- 1. Reviewing past charts to identify MA + candlestick setups
- 2. Practicing pattern recognition at MA levels
- 3. Paper trading the complete system for 20 trades
- 4. Tracking volume on every setup
📚 Continue Learning
Explore our other moving average guides:
Ready to Put This Into Practice?
Join MarketDly to access real-time market insights, AI-powered analysis, and professional trading tools.
No credit card required • Free tier available • Upgrade anytime