Swing Trading: Capturing Multi-Day Momentum
Published February 1, 2026 • 15 min read
Swing trading bridges the gap between day trading and position trading. Hold for 3-10 days to capture momentum moves without the stress of intraday volatility.
What is Swing Trading?
Swing trading captures price "swings" within a larger trend. You're trading the waves, not the tide.
- Hold Time: 3-10 days (sometimes up to 3 weeks)
- Target: 5-15% moves
- Analysis: Daily charts (primary), 4-hour charts (timing)
- Style: Technical analysis + momentum + market structure
Example Swing Trades
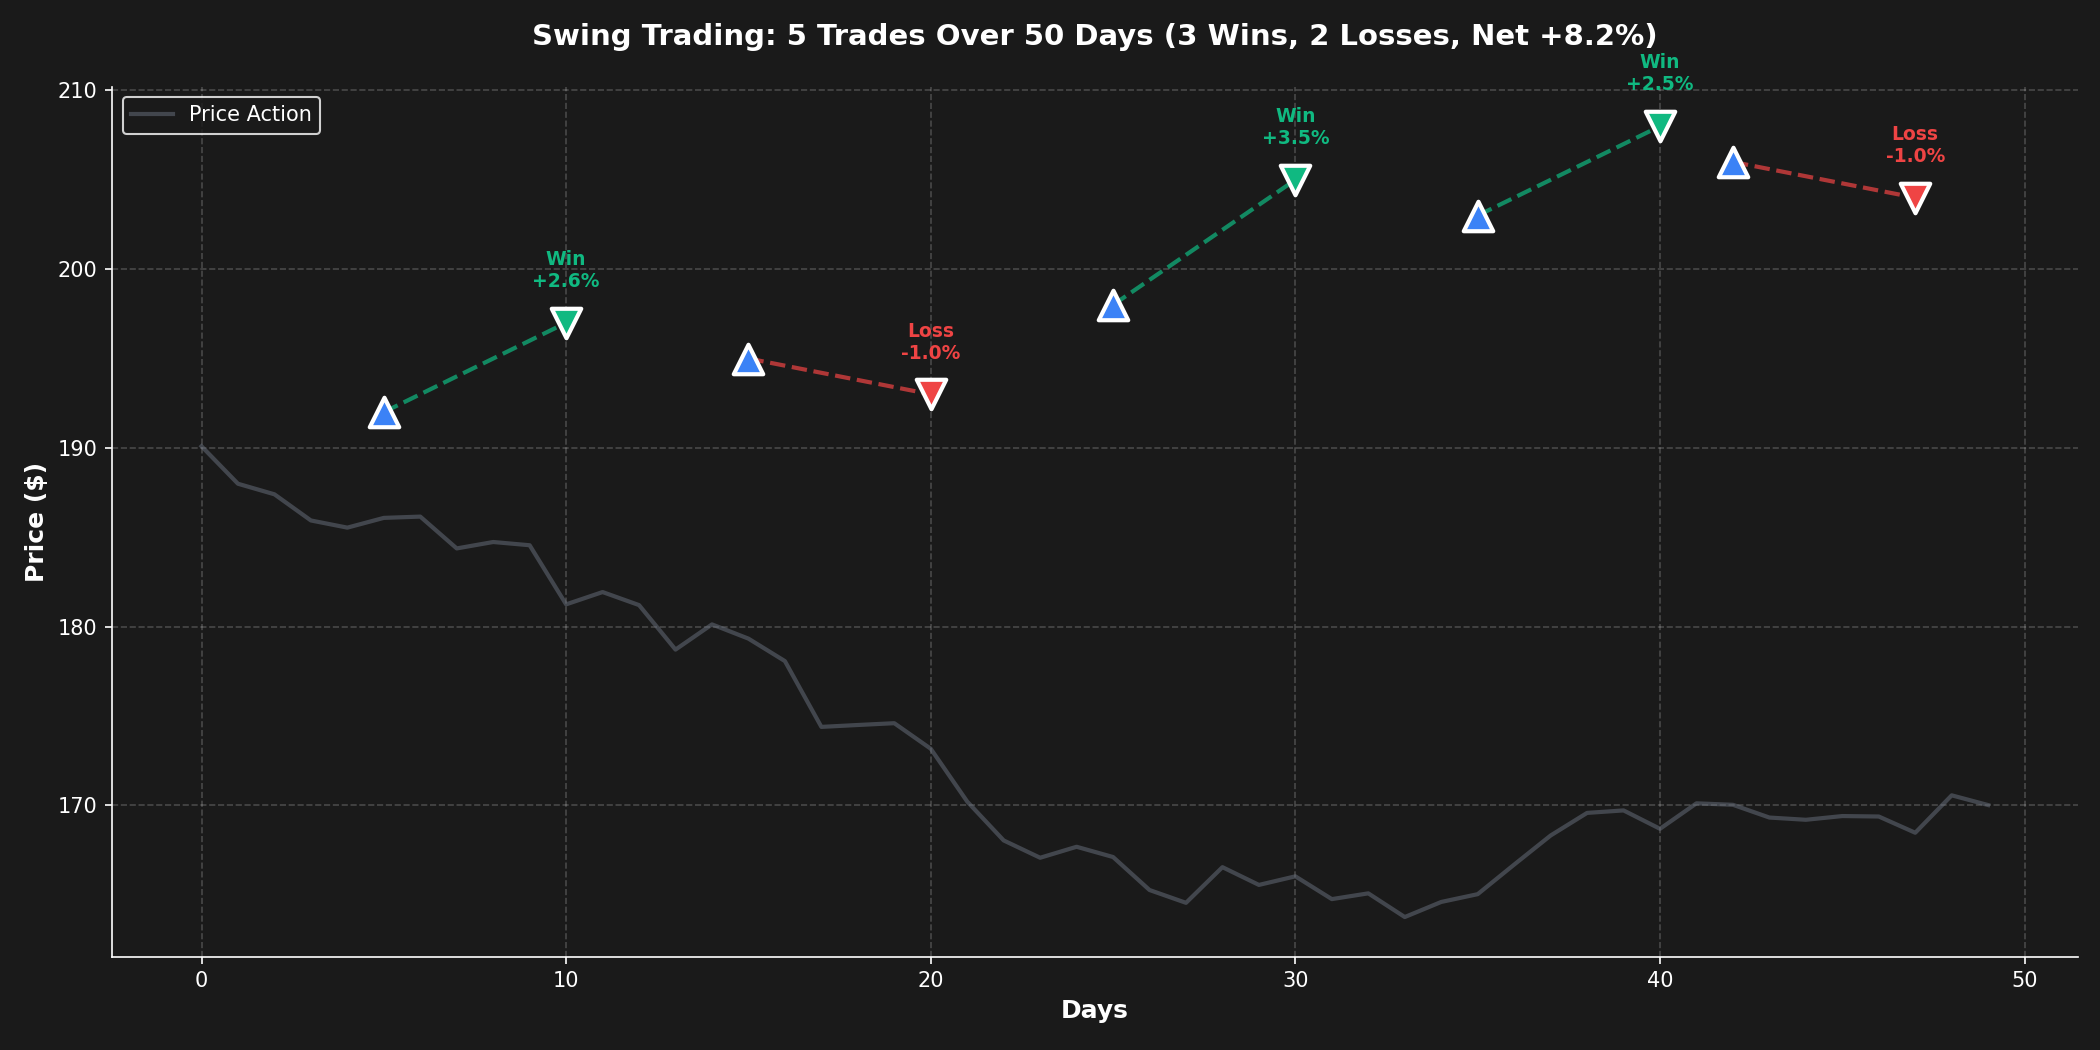
Three successful swing trades: pullback entry, breakout entry, and trend continuation. Each held 5-8 days for 7-12% gains.
Why Swing Trading Works
Advantages Over Day Trading
- No need to watch screens all day
- Avoid intraday noise and whipsaws
- Larger profit targets (5-15% vs 1-3%)
- Lower stress and better work-life balance
- Fewer commissions and slippage costs
The Three Swing Trading Setups
1. Pullback in Uptrend
Buy when strong stock pulls back to support in established uptrend. Highest win rate.
Setup Requirements:
- Stock in clear uptrend (above 20 & 50-day MA)
- Pullback to 20-day MA or prior resistance (now support)
- RSI 40-50 (healthy pullback, not oversold)
- Volume declining on pullback (no distribution)
Entry: Bounce off support with volume increase
Target: Recent high or +8-12%
Stop: Below support level or -3-4%
2. Breakout from Consolidation
Buy when stock breaks above resistance after 4+ week consolidation. Explosive potential.
Setup Requirements:
- Consolidation lasted 4-12 weeks
- Volume contracted during consolidation
- Breakout on 50%+ above average volume
- Clean break above resistance (not barely)
Entry: Breakout day or pullback to breakout level
Target: Measured move (base depth projected up)
Stop: Below consolidation or -5-7%
3. Trend Continuation
Buy when stock resumes uptrend after brief pause. Ride the momentum.
Setup Requirements:
- Strong uptrend (making higher highs/lows)
- Brief 2-5 day consolidation or flag pattern
- Price holding above rising 10-day MA
- Strong relative strength vs market
Entry: Break above flag high with volume
Target: +10-15% or until trend breaks
Stop: Below flag low or 10-day MA
Swing Trading Checklist
| Criteria | Requirement | Why It Matters |
|---|---|---|
| Trend | Above 20 & 50-day MA | Trade with momentum |
| Relative Strength | Outperforming SPY | Leaders make biggest moves |
| Volume | Above 500K daily avg | Liquidity for entries/exits |
| Volatility | ATR 3-8% | Enough movement, not chaos |
| Market | SPY in uptrend | Rising tide lifts boats |
Real Example: TSLA Swing Trade (Dec 2025)
Setup: Pullback to 20-day MA in strong uptrend
Entry: Dec 10 at $245 (bounced off MA with volume)
Initial Target: $270 (recent high)
Stop: $237 (below MA, -3.3% risk)
Result: Hit $268 on Dec 18 (8 days, +9.4% gain)
R:R: 2.8:1 (risked 3.3% to make 9.4%)
Entry Timing
Daily chart identifies the setup. 4-hour chart times the entry.
Best Entry Times
- 10:00-11:30 AM: After morning volatility settles, real direction emerges
- 2:00-3:00 PM: Afternoon momentum, avoid last-hour reversals
- Avoid first 30 min: Too much noise, wait for clarity
- Avoid last 30 min: Positions can gap against you overnight
Position Sizing
Swing trades have overnight risk. Size conservatively:
Risk per trade: 1-2% of account
Max positions: 3-5 concurrent swings
Max total risk: 6-8% of account
Example: $50K account, risk $500-$1000 per trade. With 4 positions, total risk = $2000-$4000 (4-8%).
Stop Loss Management
Initial Stop Placement
- Pullback trades: Below support level or -3-4%
- Breakout trades: Below consolidation or -5-7%
- Trend trades: Below flag low or 10-day MA
Trailing Stops
As trade moves in your favor, protect profits:
- +5% profit: Move stop to breakeven
- +8% profit: Trail stop to +3% profit
- +12% profit: Trail stop to +6% profit
- New high: Trail stop below prior day's low
Profit Taking Strategy
| Scenario | Action | Reasoning |
|---|---|---|
| Hit target (+8-12%) | Sell 50-75% | Lock in profits, let runner go |
| Strong momentum | Hold with trailing stop | Ride the trend |
| Stalling at resistance | Exit 100% | Momentum fading |
| Day 10+ no progress | Exit 100% | Time stop - capital tied up |
| Market reverses | Exit all positions | Protect capital |
Overnight Risk Management
Swing trades carry overnight gap risk. Manage it:
- Avoid earnings: Exit before earnings or don't enter within 2 weeks
- Check economic calendar: Major reports (FOMC, CPI, jobs) can gap stocks
- Reduce size before weekends: 3-day gap risk is higher
- Diversify sectors: Don't hold 5 tech stocks - spread risk
- Use wider stops: Account for overnight volatility (3-5% minimum)
Market Environment Filter
Swing trading success depends heavily on market conditions:
Trade Aggressively When:
- SPY above 20, 50, 200-day MAs (strong uptrend)
- VIX < 20 (low volatility)
- New highs > New lows (market breadth positive)
- Leading sectors showing strength
Reduce Activity When:
- SPY below 50-day MA (weak market)
- VIX > 30 (high volatility)
- Market choppy, no clear direction
- Major uncertainty (Fed meetings, geopolitical events)
Swing Trading Mistakes
- Holding losers too long: "It will come back" - No, cut losses at stop
- Taking profits too early: Selling at +3% when target is +10%
- Overtrading: More than 5 positions = can't manage properly
- Ignoring market trend: Long swings in bear market = pain
- No stop loss: "I'll just hold" - recipe for disaster
- Revenge trading: Trying to make back losses quickly
Daily Routine
Swing trading doesn't require constant monitoring, but needs discipline:
Morning (15 min):
- Check overnight news and futures
- Review open positions and stops
- Scan for new setups
Midday (10 min):
- Check if any entries triggered
- Adjust stops if needed
End of Day (10 min):
- Update trading journal
- Set alerts for tomorrow
- Review P&L and adjust plan
Performance Expectations
Realistic Swing Trading Stats:
- Win Rate: 50-60%
- Average Win: 8-12%
- Average Loss: 3-5%
- Risk:Reward: 1:2 to 1:3
- Hold Time: 5-10 days
- Trades per month: 8-15
- Monthly return: 5-15% (good months)
Advanced: Sector Rotation
Swing trade the strongest sectors as market rotates:
- Identify top 3 performing sectors (4-week RS)
- Find strongest stocks within those sectors
- Take swing trades in sector leaders
- When sector weakens, rotate to new leaders
Key Takeaways
- Swing trading captures 5-15% moves over 3-10 days
- Three main setups: pullbacks, breakouts, trend continuation
- Risk 1-2% per trade, max 3-5 concurrent positions
- Use daily charts for setup, 4-hour for entry timing
- Trail stops as profits grow, protect gains
- Market environment is critical - trade with the trend
- Avoid earnings and major news events
- Time stop: Exit if no progress after 10 days
Find Swing Trading Setups with MarketDly
Get daily scans for pullbacks, breakouts, and momentum plays
Start Free Trial