Breakout Trading: What Separates Success from Failure
Published February 1, 2026 • 14 min read
Most breakouts fail. The ones that succeed share specific characteristics. Learn to identify high-probability breakouts and avoid the traps that destroy accounts.
What is a Breakout?
A breakout occurs when price moves beyond a defined resistance level with conviction. But not all breakouts are created equal.
- True Breakout: Price sustains above resistance, continues higher
- False Breakout: Price breaks out then immediately reverses (bull trap)
- Breakout-Pullback: Price breaks out, tests breakout level, then continues
Success vs Failure Patterns
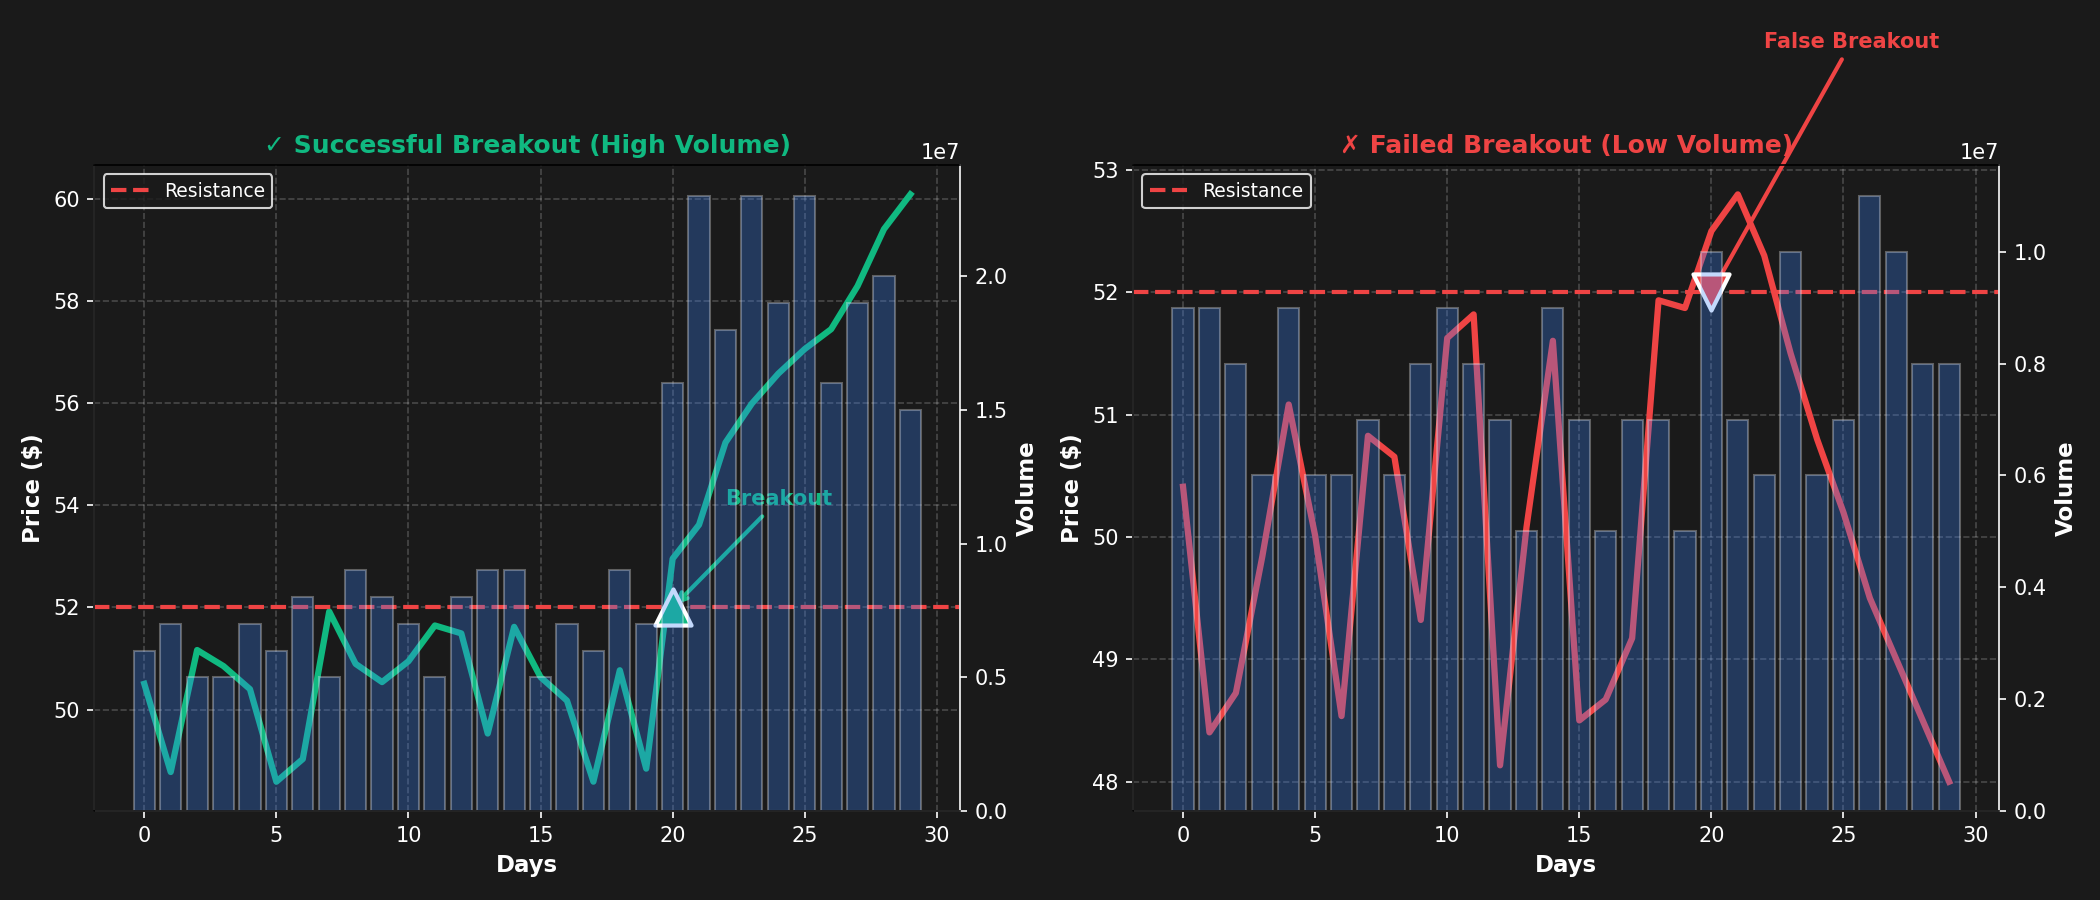
Successful breakouts show volume expansion and sustained momentum. Failed breakouts lack volume and reverse quickly.
The Breakout Success Formula
5 Critical Elements
- Tight Consolidation: At least 3 weeks, ideally 6-12 weeks
- Volume Contraction: Volume dries up during consolidation
- Volume Expansion: Breakout day volume 50%+ above average
- Clean Break: Price closes well above resistance (not just barely)
- Market Alignment: Broader market in uptrend
Consolidation Patterns
| Pattern | Success Rate | Key Feature |
|---|---|---|
| Flat Base | 75% | Tight 8-12 week range, low volatility |
| Cup & Handle | 70% | U-shaped base, handle pullback |
| Ascending Triangle | 65% | Flat top, rising lows |
| Bull Flag | 60% | Sharp rally, tight pullback |
| Loose Consolidation | 35% | Wide swings, high volatility |
Volume Analysis
Volume is the fuel for breakouts. Without it, breakouts fail.
Volume Checklist:
- Breakout volume > 150% of 50-day average = Strong
- Breakout volume > 200% of 50-day average = Very strong
- Volume declining during consolidation = Coiling energy
- Volume spike on breakout day = Institutional buying
Entry Techniques
1. Breakout Entry
Buy as price breaks above resistance with volume. Most aggressive, highest risk/reward.
Entry: Resistance + $0.10 (or 0.5% above)
Stop: Below consolidation low
2. Pullback Entry
Wait for price to break out, pull back to test breakout level, then re-enter. Lower risk, lower reward.
Entry: When price bounces off old resistance (now support)
Stop: Below pullback low
3. Anticipation Entry
Buy near the top of consolidation before breakout. Highest risk, requires experience.
Entry: Within 5% of resistance during tight consolidation
Stop: Below recent swing low
Real Example: NVDA Breakout (Oct 2025)
Setup: 8-week flat base at $480-$495, volume declining
Breakout: Oct 15, broke $495 on 2.5x average volume
Entry: $496 (just above resistance)
Stop: $478 (below base low)
Result: Ran to $565 in 6 weeks (+13.9%)
False Breakout Filters
Avoid these red flags that signal likely failure:
| Red Flag | Why It Fails |
|---|---|
| Low volume breakout | No institutional support |
| Gap up breakout | Often exhaustion, no follow-through |
| Late-day breakout | Lacks conviction, often reverses next day |
| Market in downtrend | Swimming against the tide |
| Multiple failed attempts | Resistance too strong, supply overhead |
Position Sizing for Breakouts
Breakouts have higher failure rates than other setups. Size accordingly:
Conservative: Risk 0.5-1% per breakout trade
Aggressive: Risk 1-2% on highest-conviction setups
Never risk more than 2% on a single breakout. Even the best setups fail 30-40% of the time.
Managing Breakout Trades
First 3 Days Critical
If breakout doesn't show immediate strength, exit. Don't give it "time to work."
- Day 1: Should close in top 25% of range
- Day 2-3: Should hold above breakout level
- If price closes back in base = Exit immediately
Profit Targets
Measure the depth of consolidation, project that distance from breakout:
Base Depth = High - Low of consolidation
Target = Breakout Level + Base Depth
// Example: Base from $480-$495
Base Depth = $15
Target = $495 + $15 = $510
Advanced: Breakout Stacking
When multiple timeframes break out simultaneously, success rate increases dramatically:
- Daily chart breaks out of 8-week base
- Weekly chart breaks out of 6-month base
- Monthly chart in strong uptrend
This alignment creates explosive moves. Risk 2-3% on these rare setups.
Breakout Timing
Time of day matters for breakout entries:
| Time | Success Rate | Notes |
|---|---|---|
| First 30 min | 50% | High volatility, many false moves |
| 10:00-11:30 AM | 70% | Best time - real institutional buying |
| Midday | 55% | Lower volume, less reliable |
| Last hour | 40% | Often reverses next morning |
Common Breakout Mistakes
- Chasing extended breakouts: Wait for pullback if already 5%+ above resistance
- Ignoring volume: Low-volume breakouts fail 70% of the time
- Wide stops: If stop is >8% away, position size is too large
- Holding losers: If breakout fails in 3 days, exit immediately
- Trading against market: Individual breakouts rarely work in bear markets
Breakout Checklist
Before entering any breakout:
- ✓ Consolidation lasted at least 3 weeks
- ✓ Volume contracted during consolidation
- ✓ Breakout volume > 150% of average
- ✓ Price closes well above resistance (not barely)
- ✓ Broader market in uptrend
- ✓ Stock has strong relative strength
- ✓ Stop loss clearly defined below base
- ✓ Risk is 1% or less of account
Key Takeaways
- Most breakouts fail - focus on high-probability setups only
- Volume is the #1 indicator of breakout success
- Tight consolidation (6-12 weeks) produces best breakouts
- First 3 days determine if breakout is real or false
- Best entry time: 10:00-11:30 AM with strong volume
- Risk 0.5-1% per trade, never more than 2%
- Exit immediately if price closes back in base
Scan for Breakout Setups with MarketDly
Get real-time alerts when high-probability breakouts form
Start Free Trial