Volume Analysis: Reading Institutional Footprints
Volume at price (VAP) vs volume profile. Climax volume patterns. Volume divergence signals. How to spot accumulation vs distribution. Real examples: AAPL volume patterns.
Follow the Money
Price tells you what happened. Volume tells you WHO made it happen. Institutions leave footprints. Learn to read them.
Volume Profile: Where the Action Is
What Is Volume Profile?
Volume profile shows how much volume traded at each price level. It's a horizontal histogram on your chart.
Key Concepts:
- • POC (Point of Control): Price level with highest volume = fair value
- • High Volume Nodes: Areas where institutions accumulated/distributed
- • Low Volume Nodes: Areas price moved through quickly (no interest)
- • Value Area: 70% of volume traded (where most activity occurred)
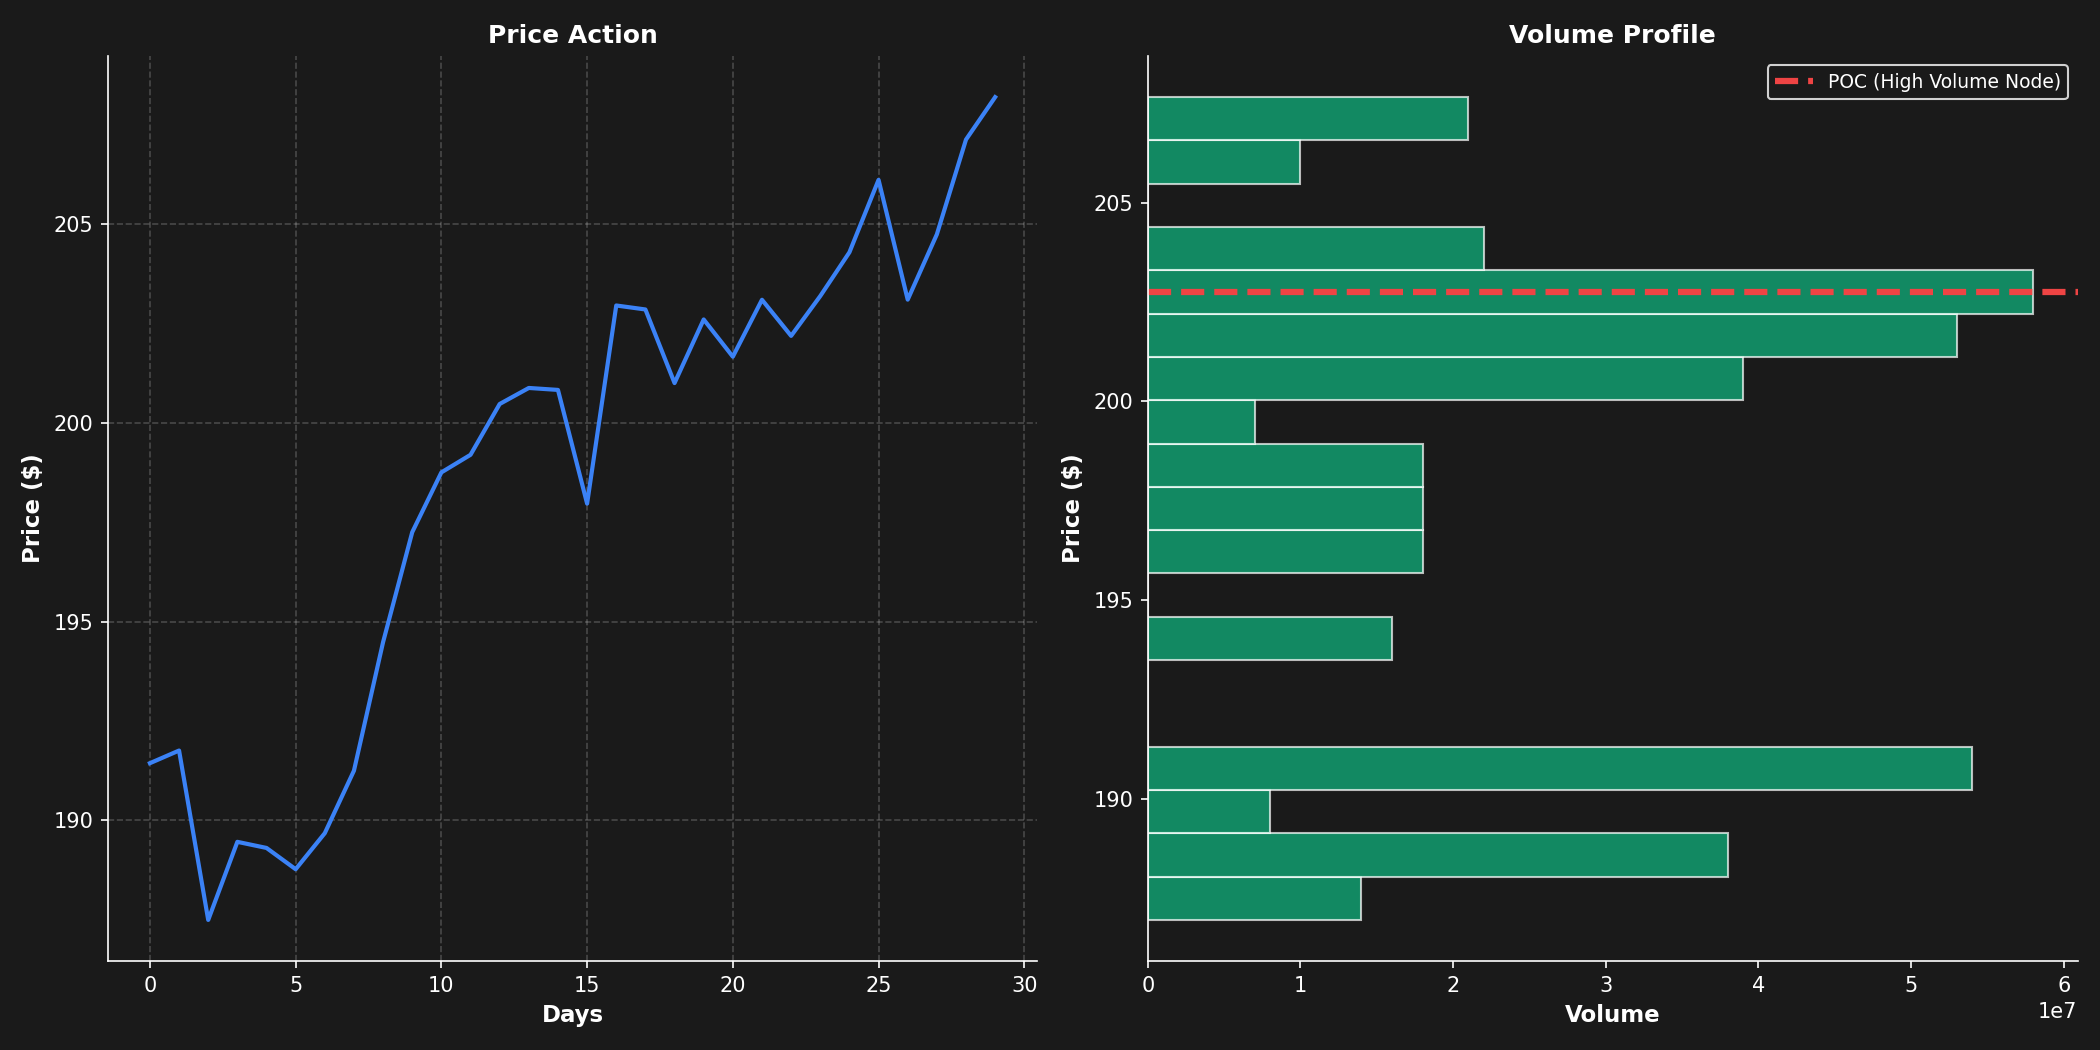
Chart: Volume profile showing POC and high volume nodes
Climax Volume: The Turning Point
What Is Climax Volume?
Climax volume occurs when volume spikes 3-5x average at a price extreme. It signals exhaustion.
Selling Climax (Bottom):
- • Price makes new low
- • Volume spikes to 3-5x average
- • Next day: Price reverses higher
- • Signal: Panic selling exhausted, buyers step in
Buying Climax (Top):
- • Price makes new high
- • Volume spikes to 3-5x average
- • Next day: Price reverses lower
- • Signal: FOMO buying exhausted, sellers take over
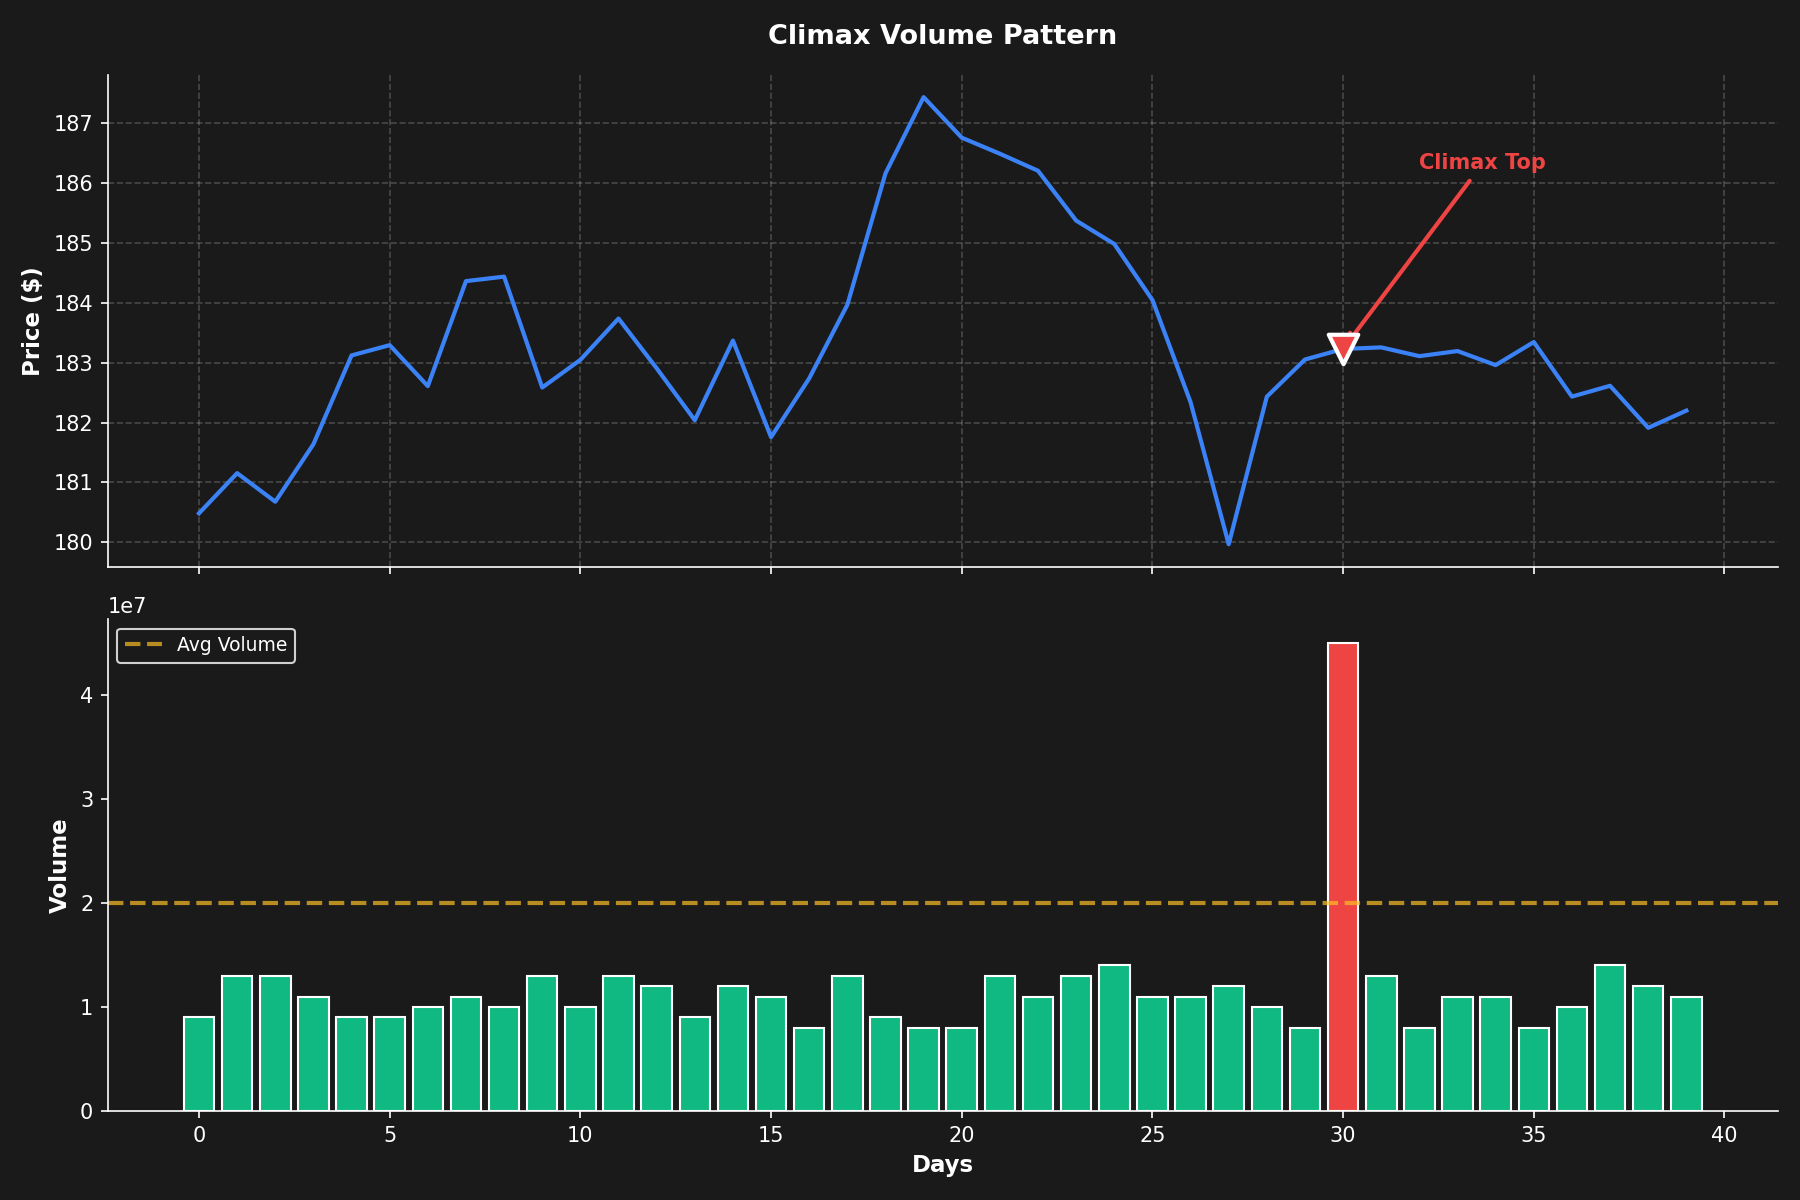
Chart: Buying climax at top with 5x volume spike
Volume Divergence: The Warning Sign
Bullish Divergence
Price makes lower low, but volume decreases. Signal: Selling pressure weakening.
Real Example: AAPL October 2025
- • First low: $170 on 50M volume
- • Second low: $168 on 30M volume (lower price, lower volume)
- • Result: Bounced to $185 (+10% in 2 weeks)
- • Why: Sellers exhausted, buyers absorbed supply
Bearish Divergence
Price makes higher high, but volume decreases. Signal: Buying pressure weakening.
Real Example: TSLA December 2025
- • First high: $250 on 80M volume
- • Second high: $255 on 45M volume (higher price, lower volume)
- • Result: Dropped to $230 (-10% in 1 week)
- • Why: Buyers exhausted, sellers took control
Accumulation vs Distribution
How to Spot Accumulation
Institutions buying (accumulation) looks different than retail buying.
Accumulation Signs:
- • Price consolidates in tight range (not trending)
- • Volume increases on up days, decreases on down days
- • Price holds support despite selling pressure
- • Small red candles, larger green candles
- • Example: Stock trades $48-$52 for 3 weeks with increasing volume
How to Spot Distribution
Institutions selling (distribution) happens at tops.
Distribution Signs:
- • Price makes new highs but can't hold them
- • Volume increases on down days, decreases on up days
- • Price fails at resistance repeatedly
- • Large red candles, small green candles
- • Example: Stock hits $200 three times but sells off each time
Volume Confirmation Rules
✓ Breakouts Need Volume
A breakout above resistance on 2x average volume is real. On low volume, it's fake.
✓ Pullbacks Should Have Low Volume
In an uptrend, pullbacks on decreasing volume = healthy. High volume pullback = trend change.
✗ Don't Trade Low Volume Stocks
Stocks with <1M daily volume are manipulated easily. Stick to liquid names.
The Bottom Line
Volume is the fuel for price moves. High volume confirms trends. Low volume warns of reversals. Climax volume signals exhaustion. Learn to read institutional footprints and you'll see moves before they happen.
Price is what you pay. Volume is what institutions do.
Ready to Apply These Strategies?
Get real-time market insights, AI-powered analysis, and professional-grade tools.