Relative Strength Analysis: Finding Market Leaders
Published February 1, 2026 • 12 min read
The strongest stocks in strong markets make the biggest moves. Relative strength analysis helps you identify which stocks are outperforming and likely to continue leading.
What is Relative Strength?
Relative strength (RS) measures how a stock performs compared to a benchmark (usually the S&P 500). It's not the same as RSI (Relative Strength Index).
RS Line = Stock Price / Index Price
- Rising RS line = Stock outperforming the market
- Falling RS line = Stock underperforming the market
- Flat RS line = Stock moving in line with market
Visual Comparison
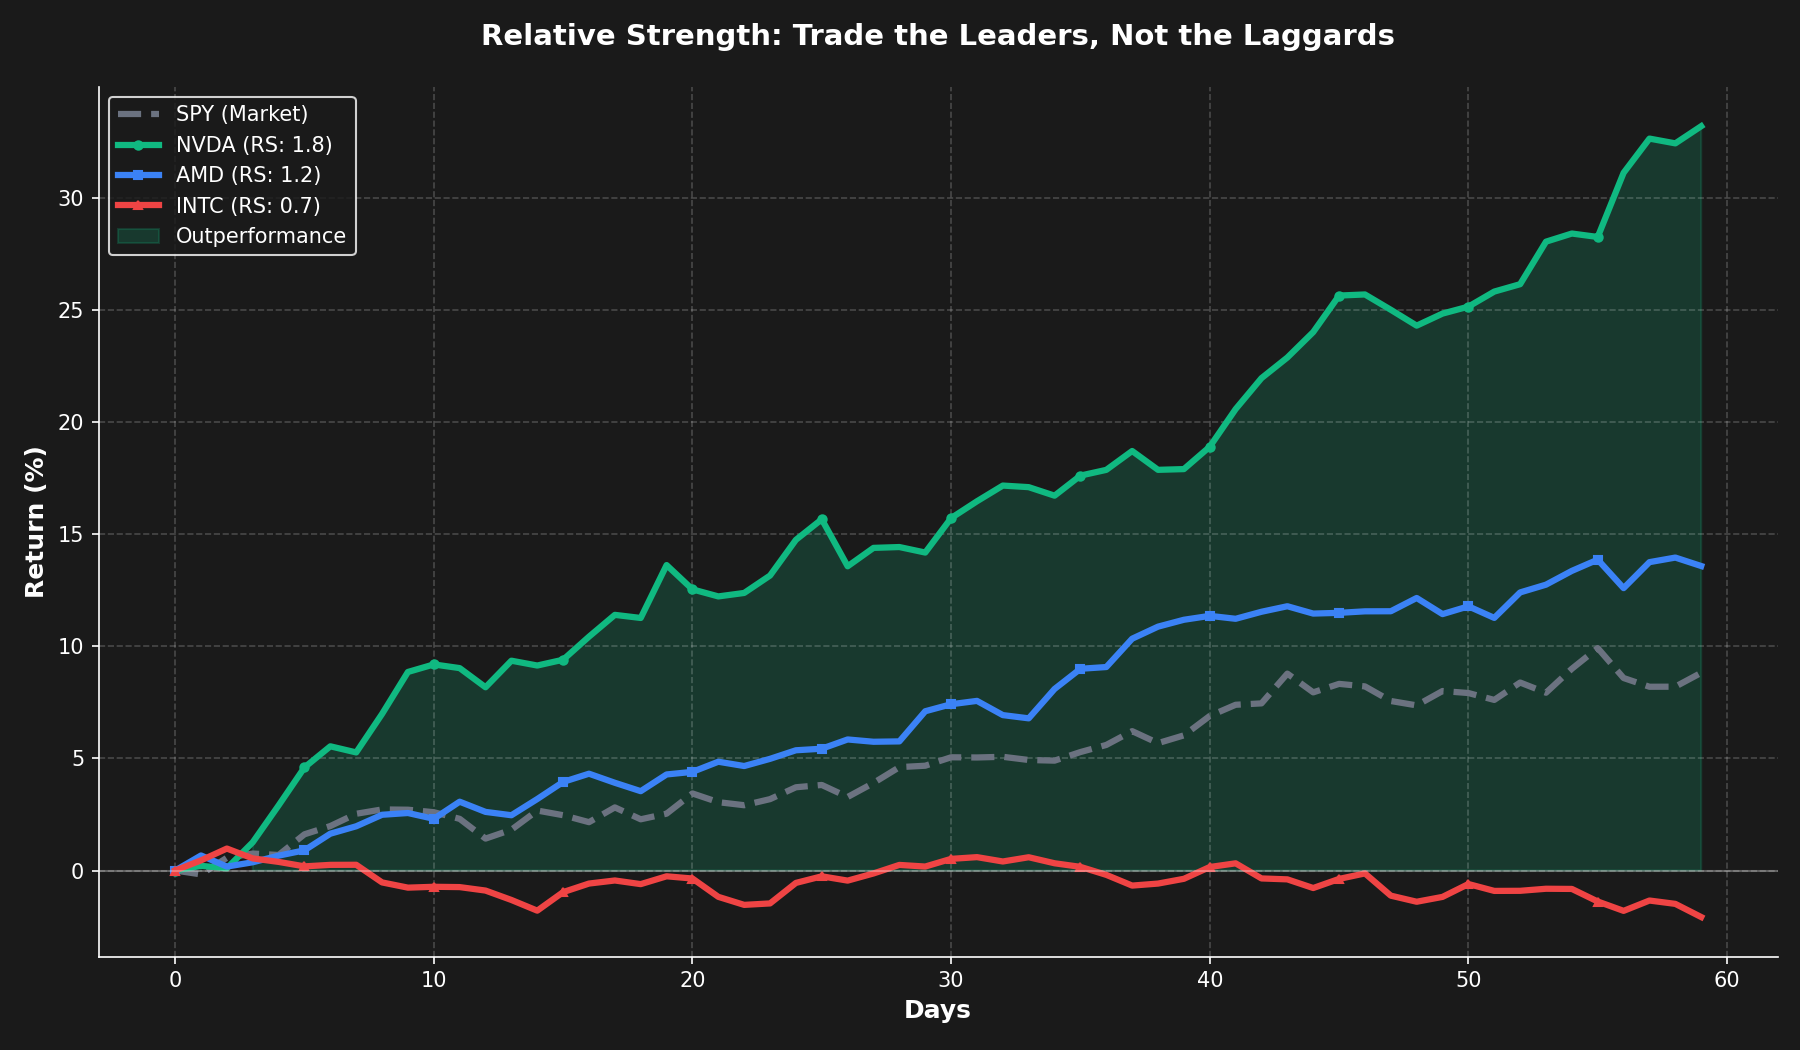
Strong RS (NVDA) vs Weak RS (XOM) - Leaders emerge during market rallies
Why Relative Strength Matters
Market Leadership Principle
In bull markets, the strongest stocks get stronger. In bear markets, the weakest stocks get weaker. RS helps you stay on the right side.
| Market Phase | RS Strategy | Expected Outcome |
|---|---|---|
| Bull Market | Buy strong RS stocks | Outperformance |
| Bear Market | Short weak RS stocks | Profit from decline |
| Sideways Market | Rotate to emerging leaders | Sector rotation gains |
How to Calculate RS
RS = (Stock Price / SPY Price) × 100
// Example: NVDA at $500, SPY at $450
RS = (500 / 450) × 100 = 111.11
// Track RS over time to see trend
RS Line Patterns
1. New RS High
Stock makes new price high AND new RS high = Strongest signal. The stock is leading the market to new territory.
2. RS Breakout
RS line breaks above resistance while price consolidates = Accumulation. Smart money is buying before the next leg up.
3. RS Divergence
Price makes new high but RS doesn't = Warning sign. The stock is losing momentum relative to the market.
Sector Rotation Strategy
Different sectors lead at different times. Use RS to identify which sectors are gaining strength:
- Calculate RS for each sector ETF (XLK, XLF, XLE, XLV, etc.)
- Rank sectors by RS performance over 4 weeks
- Focus on stocks within the top 3 sectors
- Rotate out of weakening sectors into strengthening ones
Real Example: Tech Rotation (Q4 2025)
Setup: XLK (Tech) RS line breaking to new highs while XLE (Energy) RS declining
Action: Rotated from energy stocks into NVDA, MSFT, AAPL
Result: Tech outperformed by 12% over next 8 weeks
Pair Trading with RS
Trade the spread between strong and weak RS stocks in the same sector:
- Long the sector leader (high RS)
- Short the sector laggard (low RS)
- Profit from the performance gap widening
- Market-neutral strategy (hedged against sector moves)
RS Ranking System
Create a watchlist ranked by RS performance:
RS Score = Weighted Average:
- 40% weight: 13-week RS change
- 30% weight: 26-week RS change
- 20% weight: 4-week RS change
- 10% weight: 52-week RS change
Focus on stocks with RS Score > 80 (top 20%)
Common RS Mistakes
| Mistake | Why It Fails | Better Approach |
|---|---|---|
| Buying weak RS stocks "on sale" | Weak gets weaker | Buy strength, not weakness |
| Ignoring RS in bear markets | All boats sink differently | Short weak RS, avoid strong RS |
| Using only short-term RS | Noise vs. trend | Combine multiple timeframes |
RS Confirmation Checklist
Before entering a trade based on RS, verify:
- ✓ RS line trending up for at least 4 weeks
- ✓ Stock price above 50-day and 200-day moving averages
- ✓ Volume increasing on up days
- ✓ Sector RS also strong (confirming group strength)
- ✓ No major earnings or news events imminent
Advanced: RS Momentum
Track the rate of change in RS to catch acceleration:
RS Momentum = (Current RS - RS 4 weeks ago) / RS 4 weeks ago
Stocks with RS Momentum > 10% are accelerating their outperformance.
Key Takeaways
- RS identifies market leaders and laggards objectively
- Rising RS line = Outperformance, falling RS = Underperformance
- Buy stocks making new RS highs in bull markets
- Use RS for sector rotation and pair trading strategies
- Combine RS with price action and volume for confirmation
- Track RS across multiple timeframes (4, 13, 26, 52 weeks)
Track Market Leaders with MarketDly
Get real-time relative strength rankings and sector rotation signals
Start Free Trial