How to Read Volume Profile
Master volume profile analysis. Learn to identify high-volume nodes, value areas, and use volume to predict price movement like professional traders.
Most traders look at volume as a simple bar chart at the bottom of their screen. They know "high volume is good" but don't understand WHY or HOW to use it. They miss the most powerful volume tool available: volume profile.
Volume profile shows you exactly where institutions are accumulating and distributing. It reveals support and resistance levels that price action alone can't show. This guide teaches you how to read volume profile like a professional trader.
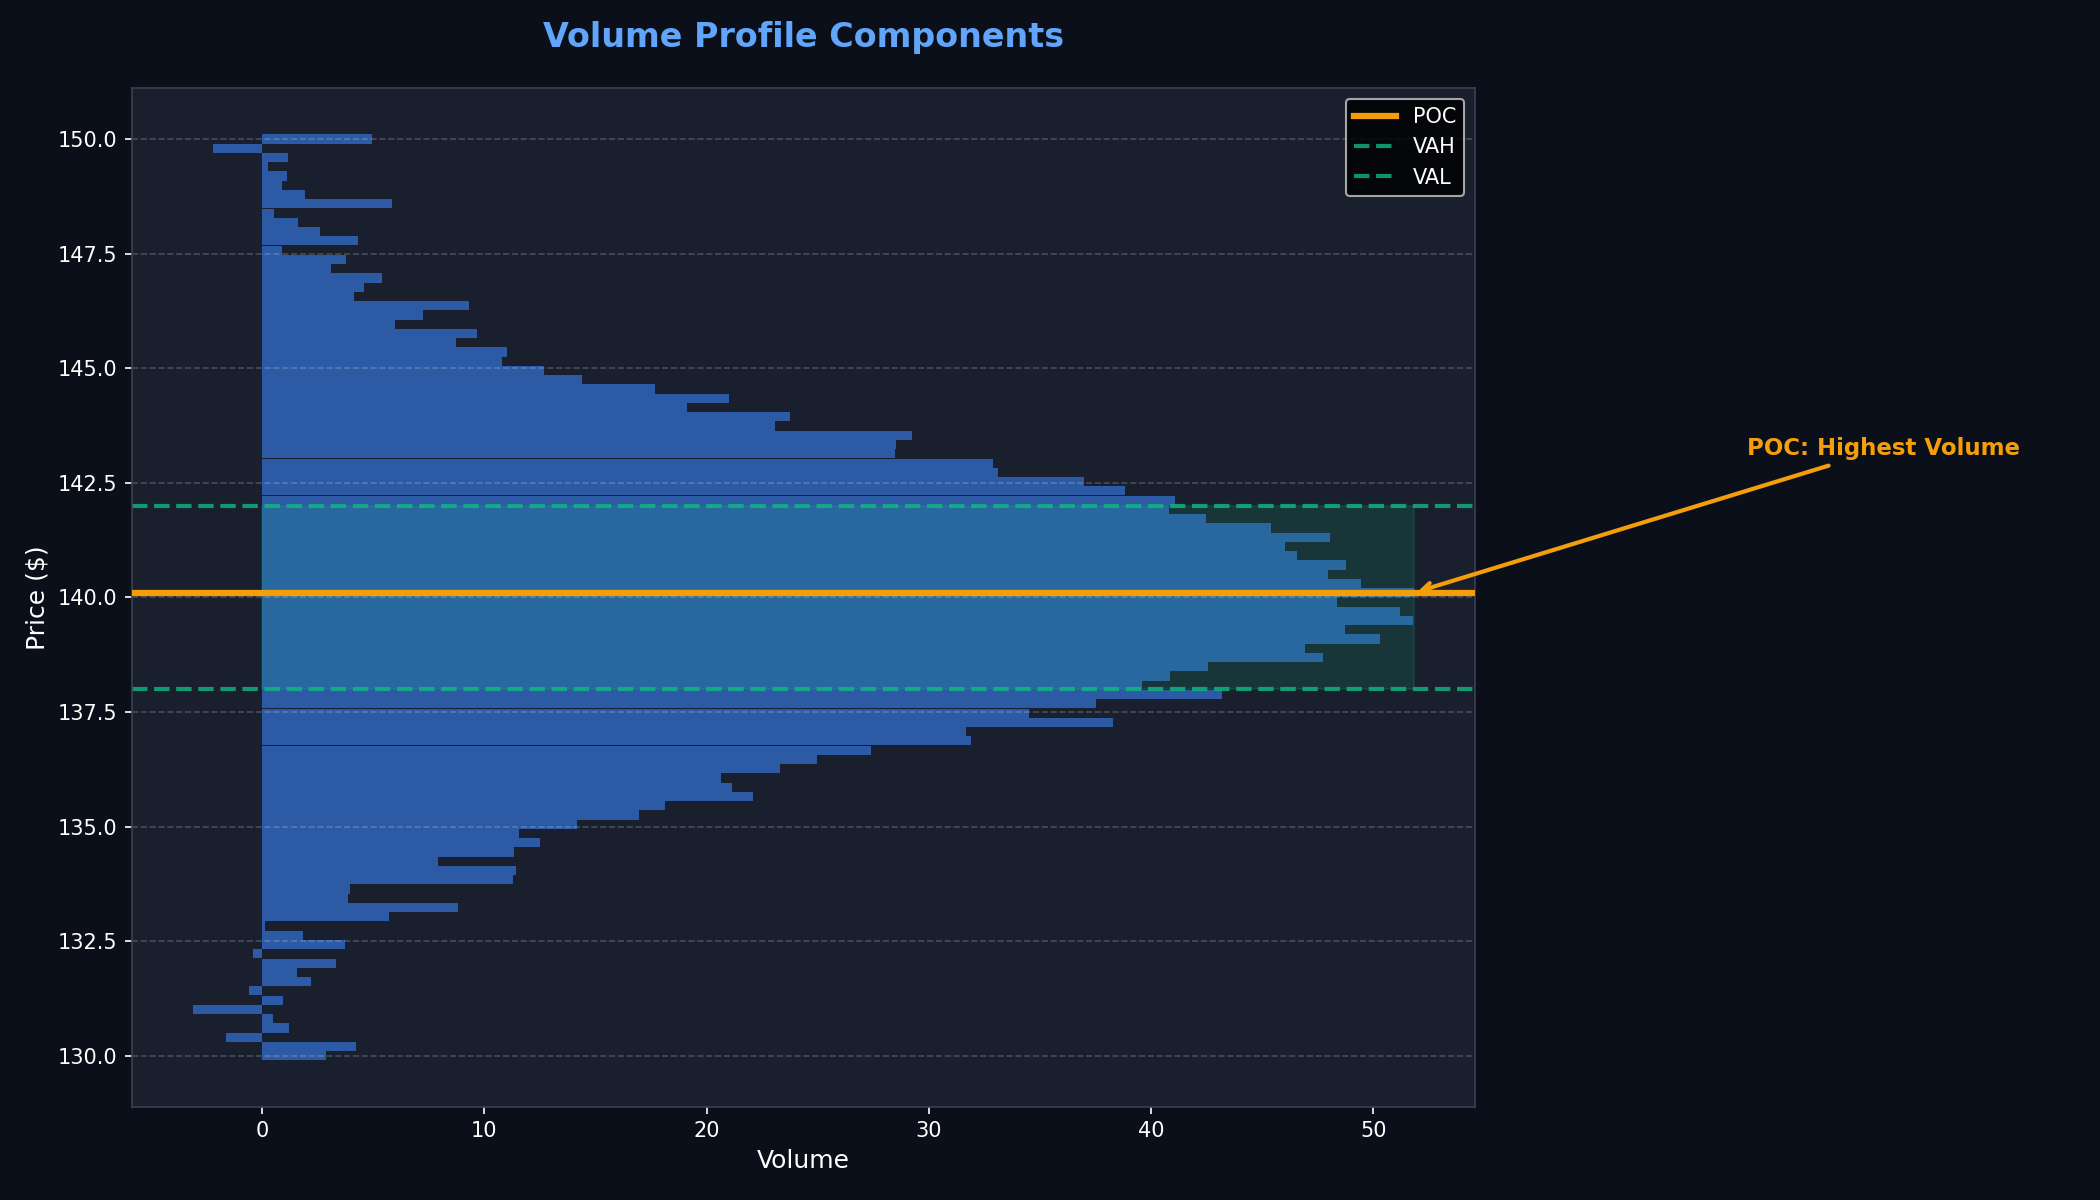
Volume Profile Components
Chart showing POC, VAH, VAL, HVNs, and LVNs clearly labeled
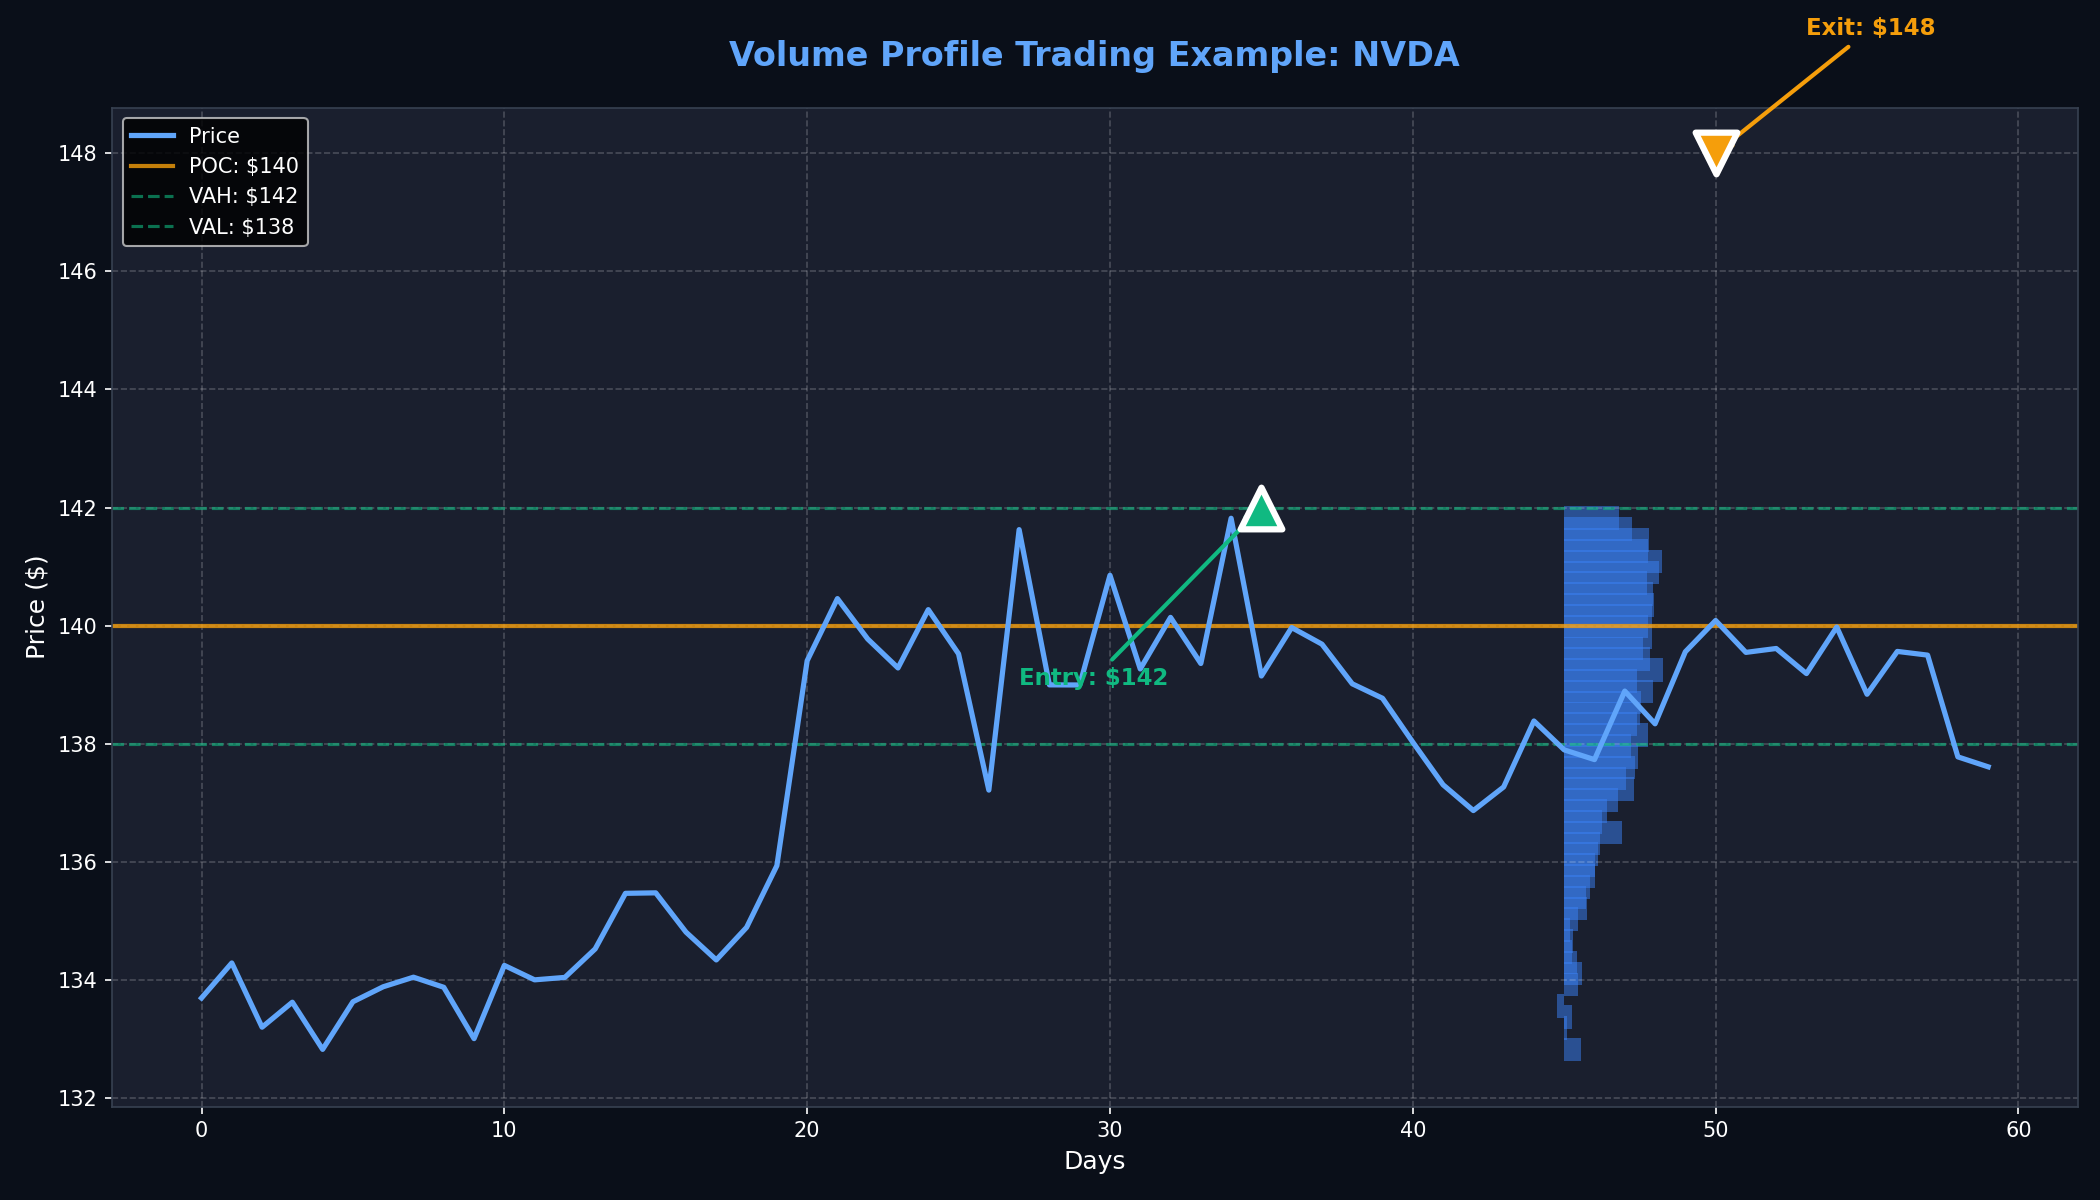
Volume Profile Trading Example
Real NVDA trade with volume profile analysis and entry/exit points
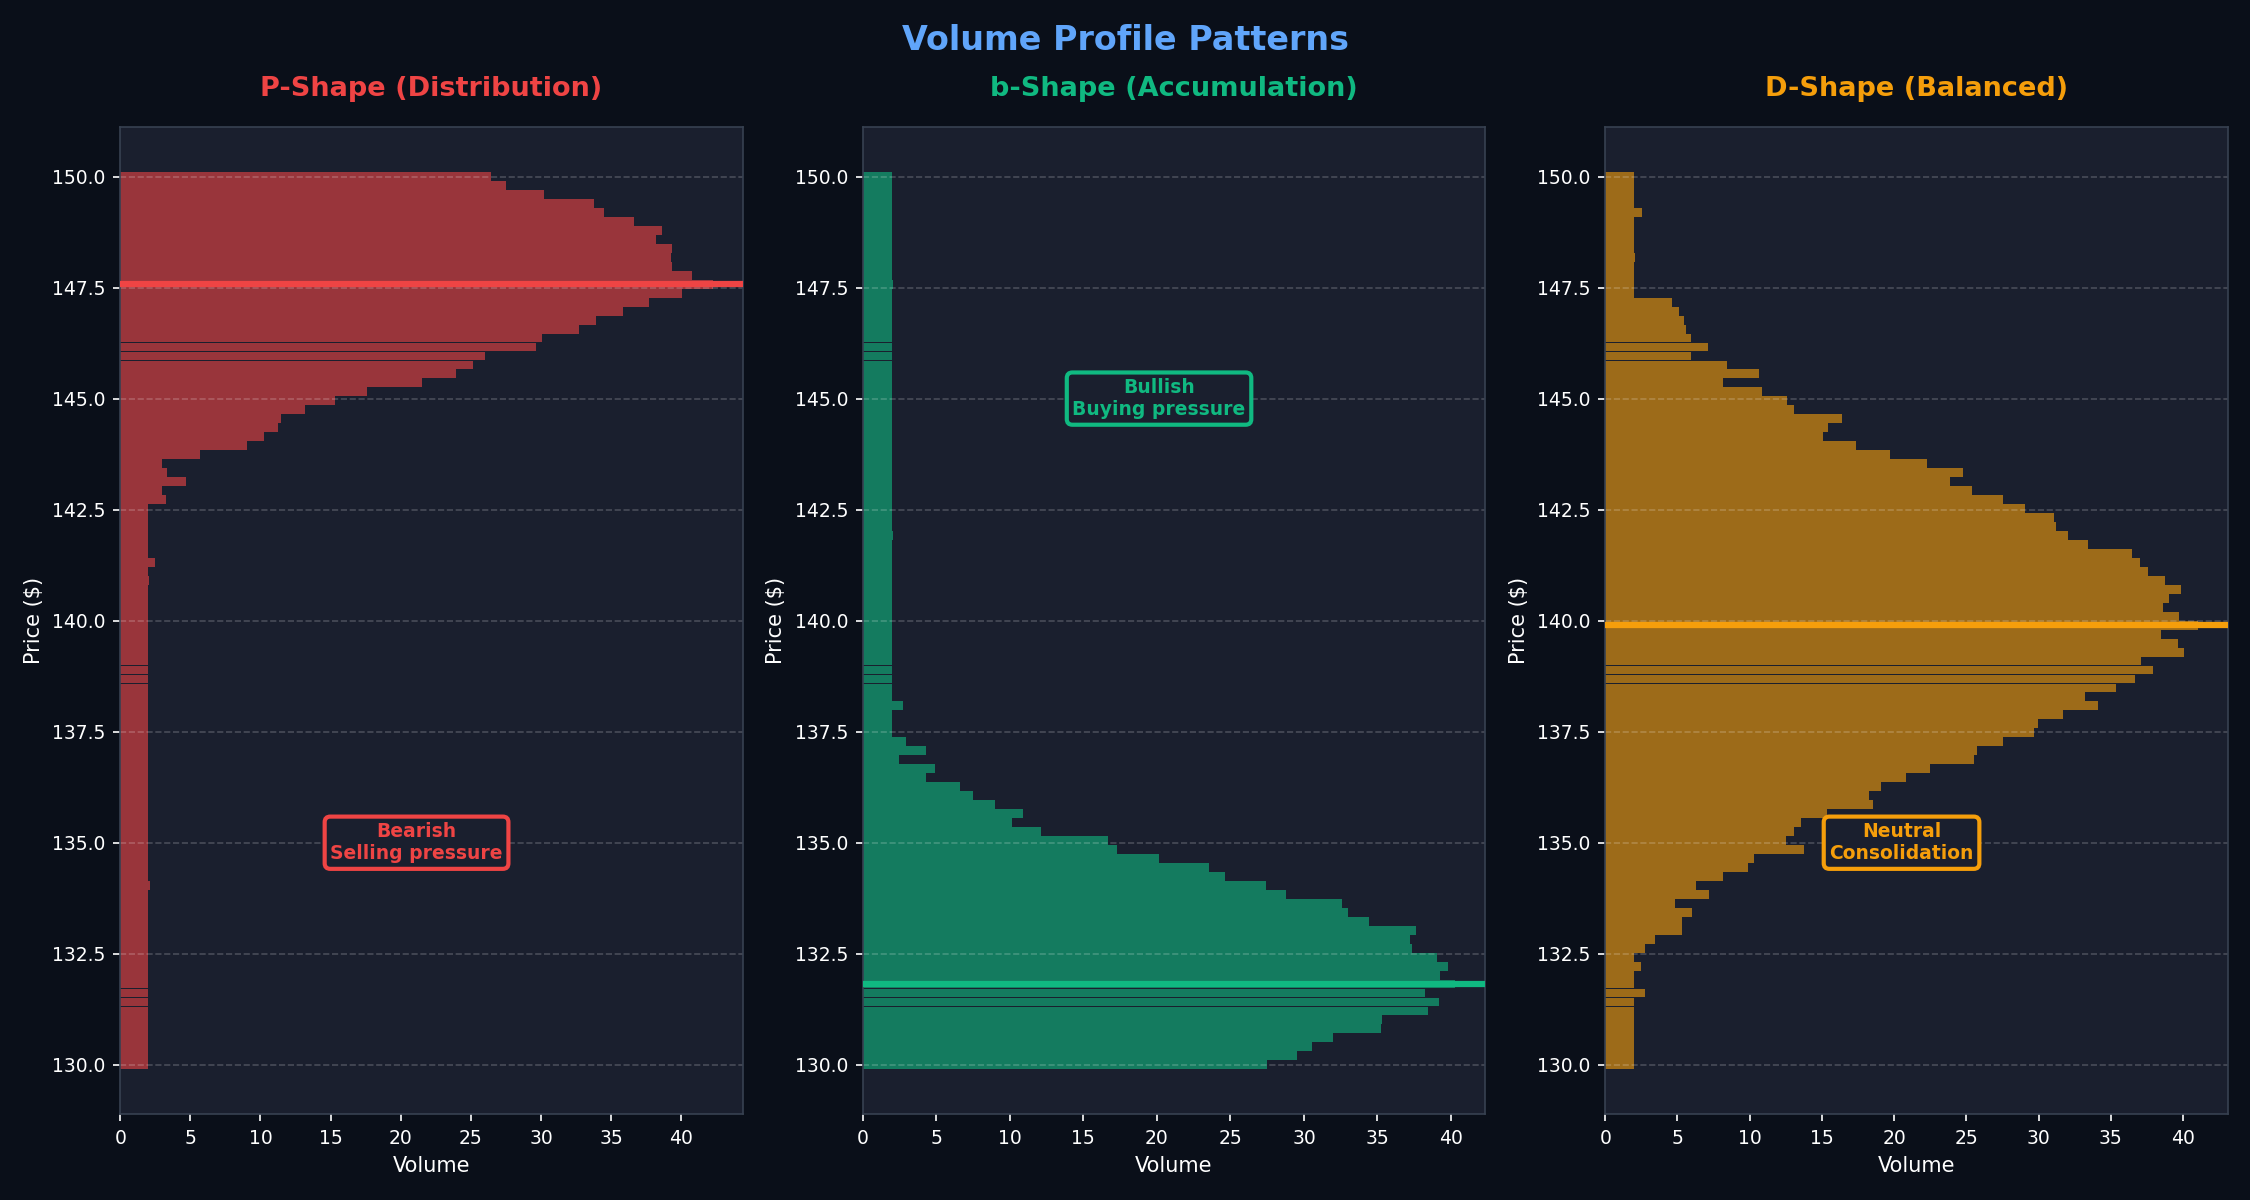
Volume Profile Patterns
Examples of P-shape, b-shape, and D-shape volume profiles
What is Volume Profile?
Volume profile is a charting tool that displays trading activity over a specified time period at specific price levels. Instead of showing volume over time (like traditional volume bars), it shows volume at each price level.
Traditional volume: Shows HOW MUCH was traded at each time period
Volume profile: Shows WHERE (at what prices) volume was traded
This distinction is critical. Knowing that 10 million shares traded today is interesting. Knowing that 8 million of those shares traded at $140 tells you that $140 is a significant level where institutions are active.
Key Volume Profile Components
Point of Control (POC)
The price level with the highest traded volume. This is the most important level on the chart.
- Significance: Where most trading activity occurred
- Trading use: Acts as strong support/resistance
- Institutional activity: Where big money is most active
POC is like a magnet - price tends to return to it repeatedly.
Value Area (VA)
The price range where 70% of volume traded. Consists of:
- Value Area High (VAH): Upper boundary of value area
- Value Area Low (VAL): Lower boundary of value area
- Value Area: The range between VAH and VAL
Price tends to stay within the value area. Moves outside it are significant.
High Volume Nodes (HVN)
Price levels with significantly higher volume than surrounding levels:
- Characteristics: Wide horizontal bars on volume profile
- Trading behavior: Price consolidates at these levels
- Support/Resistance: Act as strong S/R zones
HVNs show where institutions accumulated or distributed positions.
Low Volume Nodes (LVN)
Price levels with very little volume traded:
- Characteristics: Thin or absent horizontal bars
- Trading behavior: Price moves quickly through these levels
- Gaps: Often correspond to price gaps
LVNs are "air pockets" where price has no support/resistance.
How to Read Volume Profile
Follow this systematic approach to analyze any volume profile:
Step 1: Identify the POC
Find the longest horizontal bar - that's your POC. Ask:
- Is price above or below POC?
- Is price moving toward or away from POC?
- How far is price from POC?
Price above POC = bullish. Price below POC = bearish. Price at POC = consolidation.
Step 2: Mark Value Area Boundaries
Identify VAH and VAL. These are your key levels:
- Price above VAH = strong bullish, potential overextension
- Price below VAL = strong bearish, potential overextension
- Price within VA = normal trading, no edge
Trades outside value area have the highest probability of reverting back.
Step 3: Find HVNs and LVNs
Look for clusters of high volume and gaps of low volume:
- HVNs = potential support/resistance
- LVNs = areas price will move through quickly
- Multiple HVNs = strong consolidation zone
Plan entries at HVNs, expect fast moves through LVNs.
Volume Profile Trading Strategies
Strategy 1: POC Bounce
Setup: Price pulls back to POC in an uptrend
Entry: When price bounces off POC with volume
Stop: Below POC
Target: Previous high or next HVN
POC acts like a magnet. Price often returns to it before continuing the trend.
Strategy 2: Value Area Breakout
Setup: Price consolidating within value area
Entry: Break above VAH (bullish) or below VAL (bearish)
Stop: Back inside value area
Target: Next HVN or measured move
Breakouts from value area often lead to strong directional moves.
Strategy 3: LVN Gap Fill
Setup: Price approaching LVN from above or below
Entry: As price enters LVN
Stop: Tight stop (LVNs move fast)
Target: Next HVN on other side of LVN
Price moves quickly through LVNs - perfect for momentum trades.
Strategy 4: HVN Rejection
Setup: Price rallies into HVN resistance
Entry: When price gets rejected at HVN
Stop: Above HVN
Target: POC or next HVN below
HVNs act as strong resistance. Rejections often lead to reversals.
Volume Profile Patterns
| Pattern | Description | Interpretation | Trading Action |
|---|---|---|---|
| P-Shape | POC at top, volume decreasing down | Distribution, bearish | Look for shorts below VAL |
| b-Shape | POC at bottom, volume decreasing up | Accumulation, bullish | Look for longs above VAH |
| D-Shape | POC in middle, balanced | Neutral, consolidation | Wait for breakout |
| Double Distribution | Two POCs, split volume | Transition, uncertainty | Trade breakout direction |
Real Trading Example
Here's how I used volume profile to trade NVDA on January 28, 2026:
NVDA Volume Profile Analysis
Observation: NVDA consolidating for 3 weeks between $135-$142
Volume Profile Setup:
- POC: $138 (highest volume)
- VAH: $141
- VAL: $136
- HVN at $138 (POC) and $140
- LVN above $142 (gap from previous breakout)
Analysis: Price at VAH ($141), testing breakout. LVN above suggests fast move if it breaks.
Trade Plan:
- Entry: $142 (above VAH, entering LVN)
- Stop: $140 (back to HVN)
- Target: $148 (next HVN from previous profile)
Result: Entered $142.10, moved quickly through LVN, exited $147.50. +$5.40/share.
Volume Profile Timeframes
Volume profile can be applied to different timeframes. Each tells a different story:
Session Volume Profile
Timeframe: Single trading day
Use: Day trading, intraday levels
Key levels: Today's POC, VAH, VAL
Resets daily. Good for day traders.
Composite Volume Profile
Timeframe: Multiple days/weeks
Use: Swing trading, key levels
Key levels: Major POC, long-term HVNs
Shows where institutions accumulated over time.
Fixed Range Volume Profile
Timeframe: Specific price range
Use: Analyzing consolidations, bases
Key levels: Range POC, breakout levels
Perfect for analyzing consolidation patterns.
Common Volume Profile Mistakes
Mistake #1: Using volume profile alone
Volume profile is powerful but not sufficient. Combine it with price action, trend analysis, and market context. Don't trade solely based on volume levels.
Mistake #2: Ignoring price action
A HVN is only support if price respects it. If price blows through a HVN without hesitation, it's not support anymore. Always confirm with price action.
Mistake #3: Wrong timeframe
Day traders using weekly volume profiles or swing traders using hourly profiles will get misleading signals. Match your volume profile timeframe to your trading timeframe.
Mistake #4: Overcomplicating
You don't need to analyze every HVN and LVN. Focus on POC, VAH, and VAL. These three levels give you 80% of the edge.
Volume Profile Tools
TradingView
Volume Profile Indicator: Built-in, free
Types: Fixed Range, Session, Visible Range
Customization: Excellent
Best free option for volume profile analysis.
Thinkorswim
Volume Profile Indicator: TPO Profile
Types: Session, Composite
Customization: Advanced
Professional-grade volume profile tools.
Sierra Chart
Volume Profile Indicator: Multiple types
Types: All variations
Customization: Extensive
Most advanced, but steeper learning curve.
Advanced Volume Profile Concepts
Volume Profile Migration: When POC moves from one level to another, it signals a shift in institutional positioning. Track POC movement to identify trend changes early.
Naked POCs: POCs from previous periods that haven't been retested. These act as strong magnets - price often returns to test them.
Volume Gaps: Large LVNs between HVNs. These are "air pockets" where price accelerates. Perfect for momentum trades.
Composite vs Session: When session POC differs significantly from composite POC, it shows short-term vs long-term disagreement. Trade toward the composite POC.
The Bottom Line
Volume profile reveals what price action alone cannot: where institutions are active, where support and resistance truly exist, and where price is likely to move quickly.
Most traders ignore volume profile or find it too complex. This creates an edge for those who master it. The key concepts - POC, value area, HVNs, and LVNs - are simple once you understand them.
Start by adding volume profile to your charts. Focus on identifying POC and value area boundaries. After analyzing 20-30 charts, the patterns will become obvious. You'll start seeing support and resistance levels that other traders miss.
Continue Learning
Ready to Put This Into Practice?
Join MarketDly to access real-time market insights, AI-powered analysis, and professional trading tools.
No credit card required • Free tier available • Upgrade anytime