How to Analyze a Chart in 5 Minutes
Quick technical analysis checklist used by professional traders. Learn to analyze any chart in under 5 minutes and make confident trading decisions.
Most traders stare at charts for 20-30 minutes, adding indicators, drawing lines, and still can't decide if it's a good trade. They overthink, second-guess, and miss opportunities while "analyzing."
Professional traders analyze charts in under 5 minutes using a systematic checklist. They look at the same things every time, in the same order, and make decisions quickly. This guide shows you exactly how.
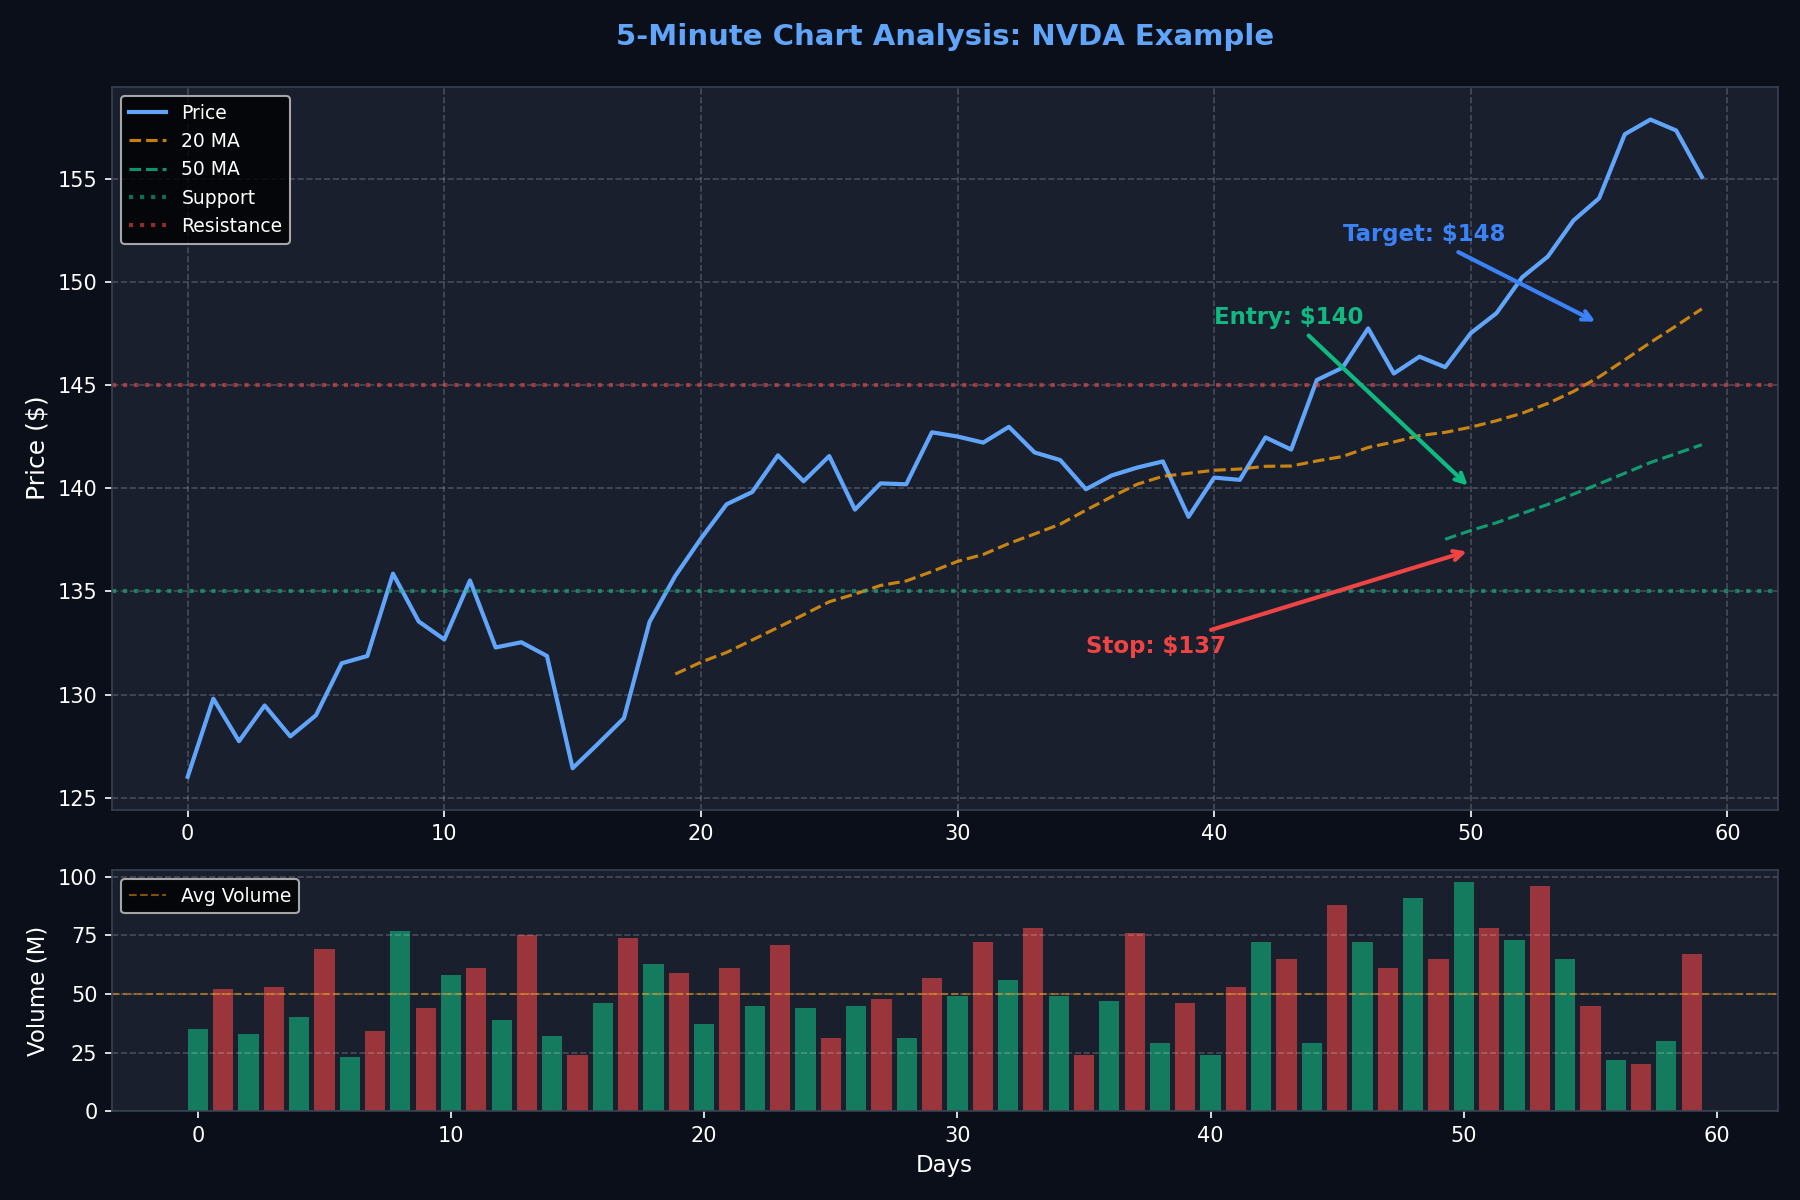
Annotated Chart Example
NVDA chart showing trend, key levels, volume analysis, and entry/stop/target
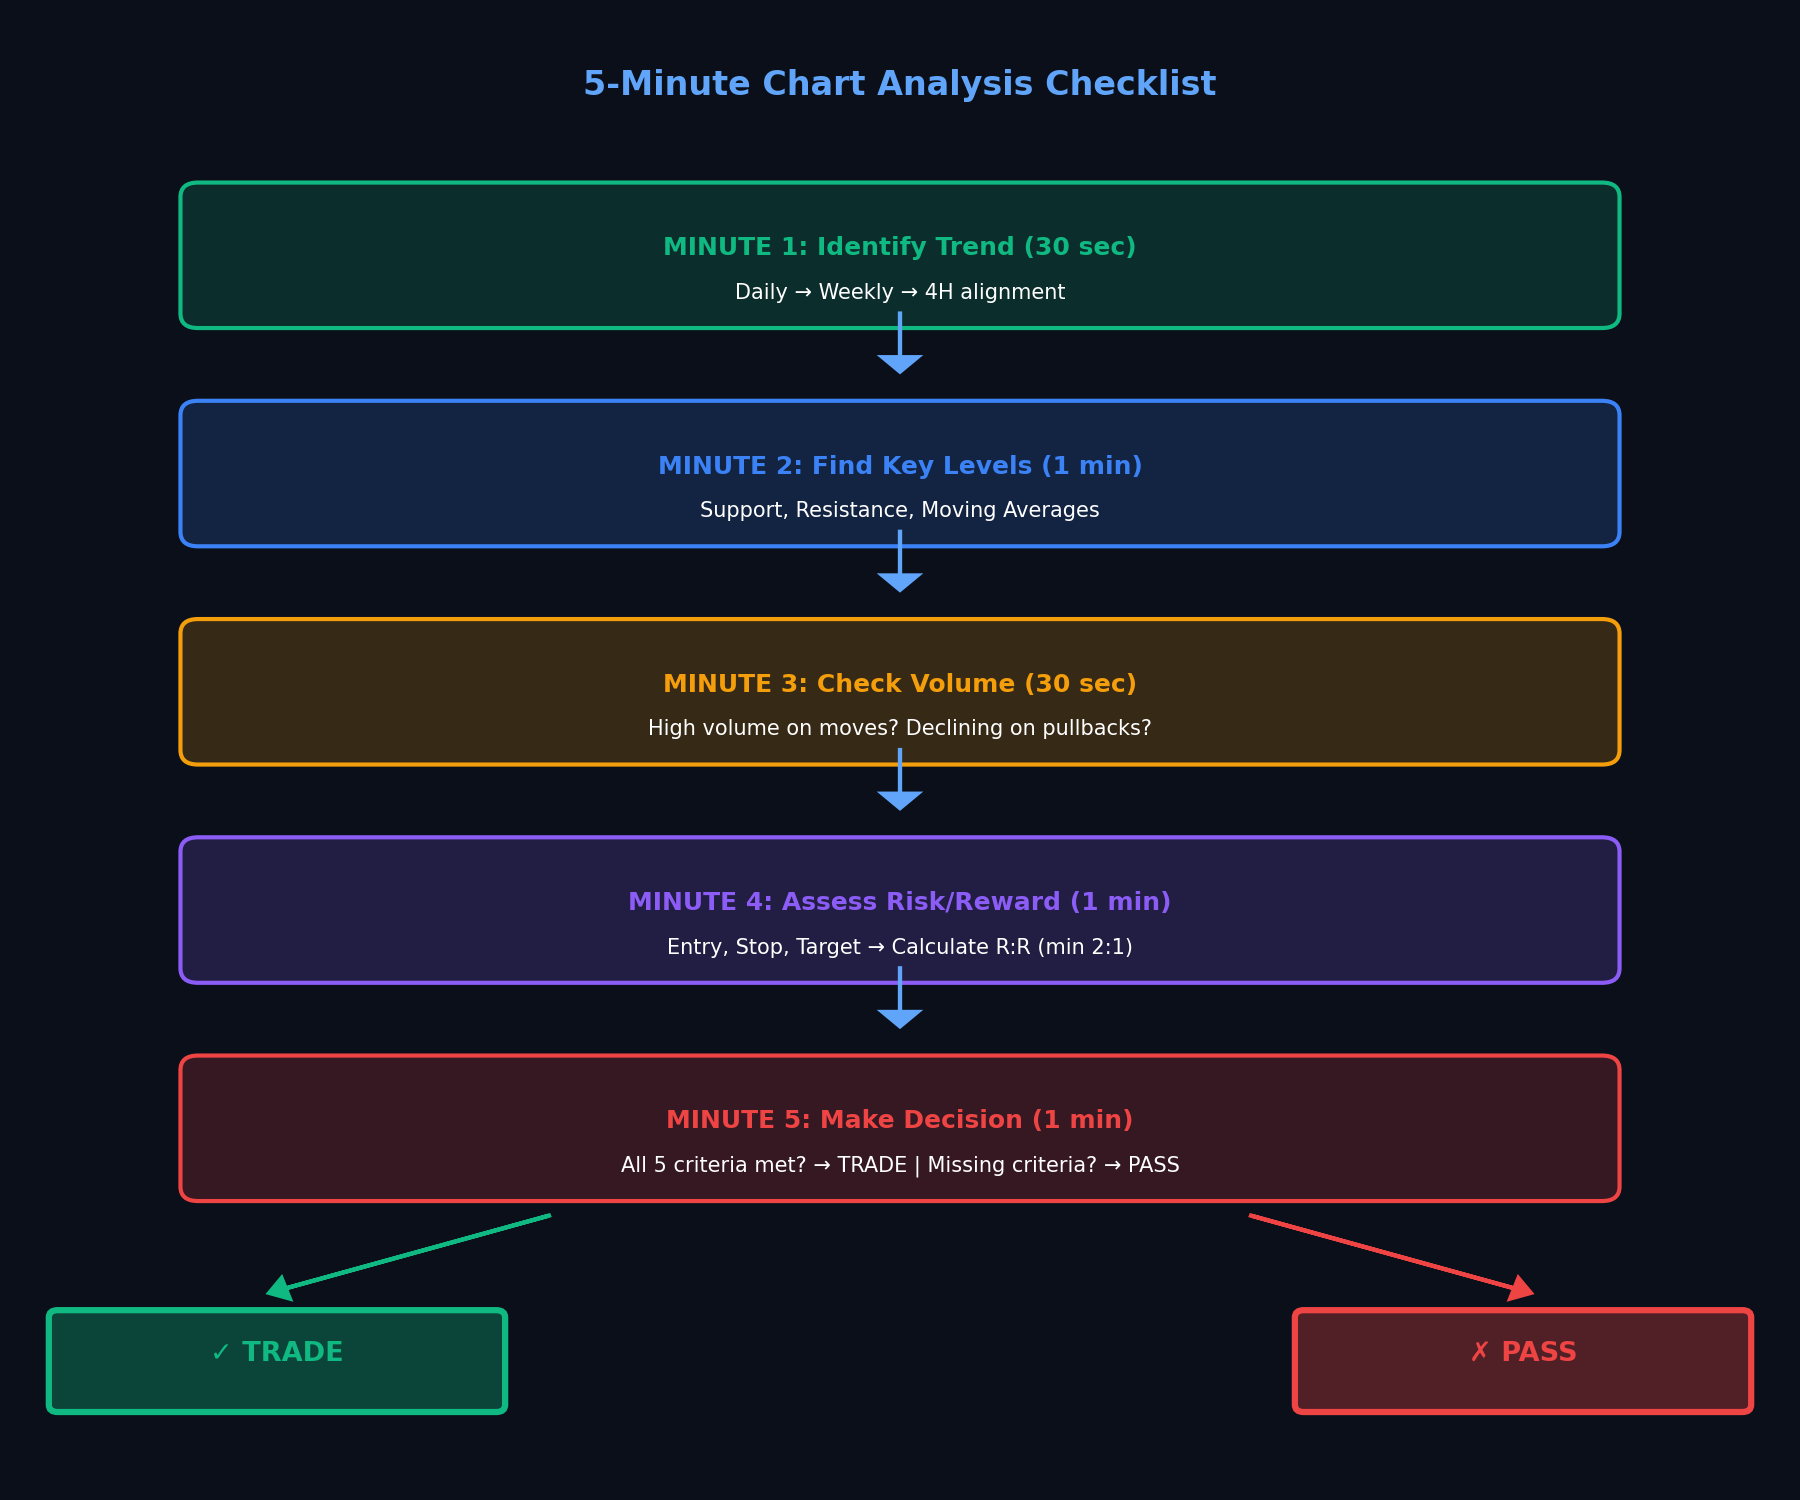
5-Minute Analysis Checklist
Visual flowchart of the complete analysis process
Why Speed Matters in Chart Analysis
Fast analysis isn't about being reckless - it's about being systematic. When you have a repeatable process, you can evaluate charts quickly without missing critical information.
Prevents overthinking: The longer you stare at a chart, the more patterns you'll "see" that aren't really there. Quick analysis keeps you objective.
Improves consistency: Using the same checklist every time means you're comparing apples to apples. You can track which setups work and which don't.
Captures opportunities: Markets move fast. By the time you've spent 30 minutes analyzing, the setup might be gone. Fast analysis lets you act on good setups before they disappear.
The 5-Minute Analysis Framework
Here's the complete process, broken down minute-by-minute:
Minute 1: Identify the Trend (30 seconds)
Look at three timeframes in this order:
- Daily chart: Is it making higher highs and higher lows (uptrend) or lower highs and lower lows (downtrend)?
- Weekly chart: What's the bigger picture trend?
- 4-hour chart: What's the intermediate trend?
Rule: Only trade with the daily trend. If daily is up but weekly is down, be cautious.
Minute 2: Find Key Levels (1 minute)
Mark these levels on your chart:
- Support: Where has price bounced multiple times?
- Resistance: Where has price been rejected multiple times?
- Moving averages: 20, 50, and 200-day MAs
You're looking for obvious levels where price has reacted before. Don't overthink it - if you have to squint to see it, it's not a key level.
Minute 3: Check Volume (30 seconds)
Volume tells you if the move is real:
- Breakouts: Need volume 50%+ above average
- Pullbacks: Should have declining volume
- Reversals: Need volume surge on the reversal day
Low volume moves are suspect. High volume confirms the move is legitimate.
Minute 4: Assess Risk/Reward (1 minute)
Calculate your trade parameters:
- Entry: Where would you enter? (breakout level, support bounce, etc.)
- Stop: Where would you be wrong? (below support, below recent low)
- Target: Where's the next resistance or measured move?
Minimum 2:1 reward-to-risk. If you can't get 2:1, skip the trade.
Minute 5: Make the Decision (1 minute)
Use this simple checklist:
- ✓ Trend is clear and in your favor
- ✓ Price is at a key level (support/resistance)
- ✓ Volume confirms the move
- ✓ Risk/reward is at least 2:1
- ✓ Setup matches your strategy
If all 5 boxes are checked, it's a trade. If not, move on.
The Essential Chart Checklist
Print this out and keep it next to your monitor. Check every item before taking a trade:
| Category | What to Check | Green Light | Red Flag |
|---|---|---|---|
| Trend | Daily, weekly, 4H alignment | All pointing same direction | Conflicting timeframes |
| Structure | Higher highs/lows or lower highs/lows | Clear pattern | Choppy, no pattern |
| Support/Resistance | Key levels nearby | At major S/R | No clear levels |
| Volume | Confirmation on moves | High on breakouts | Low/declining volume |
| Moving Averages | 20, 50, 200 MA position | Price above all MAs | Below 200 MA |
| Risk/Reward | Entry to stop vs target | 2:1 or better | Less than 2:1 |
Common Analysis Mistakes
Mistake #1: Using too many indicators
Every indicator you add is another thing to analyze and another source of conflicting signals. Stick to price action, volume, and 2-3 moving averages. That's it.
Mistake #2: Analyzing in isolation
A chart doesn't exist in a vacuum. Check the overall market (SPY), the sector, and related stocks. If the market is tanking, your bullish setup probably won't work.
Mistake #3: Ignoring timeframe context
A bullish setup on the 5-minute chart means nothing if the daily chart is in a downtrend. Always start with higher timeframes and work down.
Mistake #4: Looking for perfection
No setup will check every box perfectly. You're looking for setups with edge, not perfect setups. If 4 out of 5 criteria are met, that's often enough.
Setup-Specific Analysis
Different setups require slightly different analysis focus:
Breakout Analysis
Key things to check:
- ✓ Consolidation lasted at least 3 weeks
- ✓ Volume is contracting during consolidation
- ✓ Breakout has volume surge (50%+ above average)
- ✓ No major resistance nearby
- ✓ Relative strength vs market is positive
Pullback Analysis
Key things to check:
- ✓ Uptrend is intact (higher highs and lows)
- ✓ Pullback is 10-20% from highs
- ✓ Volume declining on pullback
- ✓ Bouncing at key support (MA, prior resistance)
- ✓ RSI oversold but not extreme
Reversal Analysis
Key things to check:
- ✓ Clear downtrend preceded the reversal
- ✓ Volume spike on reversal day
- ✓ Reversal candle is significant (engulfing, hammer)
- ✓ Bouncing at major support level
- ✓ Momentum indicators showing divergence
Real Example: 5-Minute Analysis
Here's how I analyzed NVDA on January 29, 2026:
Minute 1 - Trend Check:
- ✓ Daily: Uptrend, making higher highs
- ✓ Weekly: Strong uptrend, no resistance nearby
- ✓ 4H: Consolidating after recent breakout
Minute 2 - Key Levels:
- Support: $138 (prior resistance, now support)
- Resistance: $145 (recent high)
- MAs: Above 20, 50, 200 - all trending up
Minute 3 - Volume:
- ✓ Breakout had 2x average volume
- ✓ Consolidation has declining volume (healthy)
- ✓ No distribution (selling) visible
Minute 4 - Risk/Reward:
- Entry: $140 (above consolidation)
- Stop: $137 (below support) = $3 risk
- Target: $148 (measured move) = $8 reward
- R:R = 2.67:1 ✓
Minute 5 - Decision:
TRADE - All criteria met. Set alert at $140.
Advanced Tips
Use templates: Save your chart layout with the indicators and timeframes you use. Don't waste time setting up charts every time.
Batch analysis: Analyze 5-10 charts in one session rather than one at a time throughout the day. This keeps you in "analysis mode" and improves consistency.
Keep a decision log: Write down why you took or passed on each setup. After 50 analyses, you'll see patterns in what works for you.
Set time limits: Use a timer. If you can't make a decision in 5 minutes, the setup probably isn't clear enough. Move on.
The Bottom Line
Fast chart analysis isn't about cutting corners - it's about having a systematic process that you execute the same way every time. The 5-minute framework forces you to focus on what matters: trend, levels, volume, and risk/reward.
Most traders fail because they overthink and second-guess. They see patterns that aren't there and miss obvious setups because they're too busy analyzing. The solution is a simple checklist that you follow religiously.
Start with this framework, track your results, and refine based on what actually produces winning trades. Within a few weeks, you'll be analyzing charts faster and more accurately than traders who spend 10x longer staring at screens.
Continue Learning
Ready to Put This Into Practice?
Join MarketDly to access real-time market insights, AI-powered analysis, and professional trading tools.
No credit card required • Free tier available • Upgrade anytime