Mean Reversion: Trading the Rubber Band Effect
Published February 1, 2026 • 13 min read
Prices stretched too far from their average tend to snap back. Mean reversion trading exploits this statistical tendency for consistent profits in range-bound markets.
What is Mean Reversion?
Mean reversion is the tendency for prices to return to their average after extreme moves. Like a rubber band stretched too far, price eventually snaps back.
- The Mean: Moving average (20, 50, or 200-day)
- Oversold: Price stretched below the mean
- Overbought: Price stretched above the mean
- Reversion: Price returns to the mean
Oversold Bounce Example
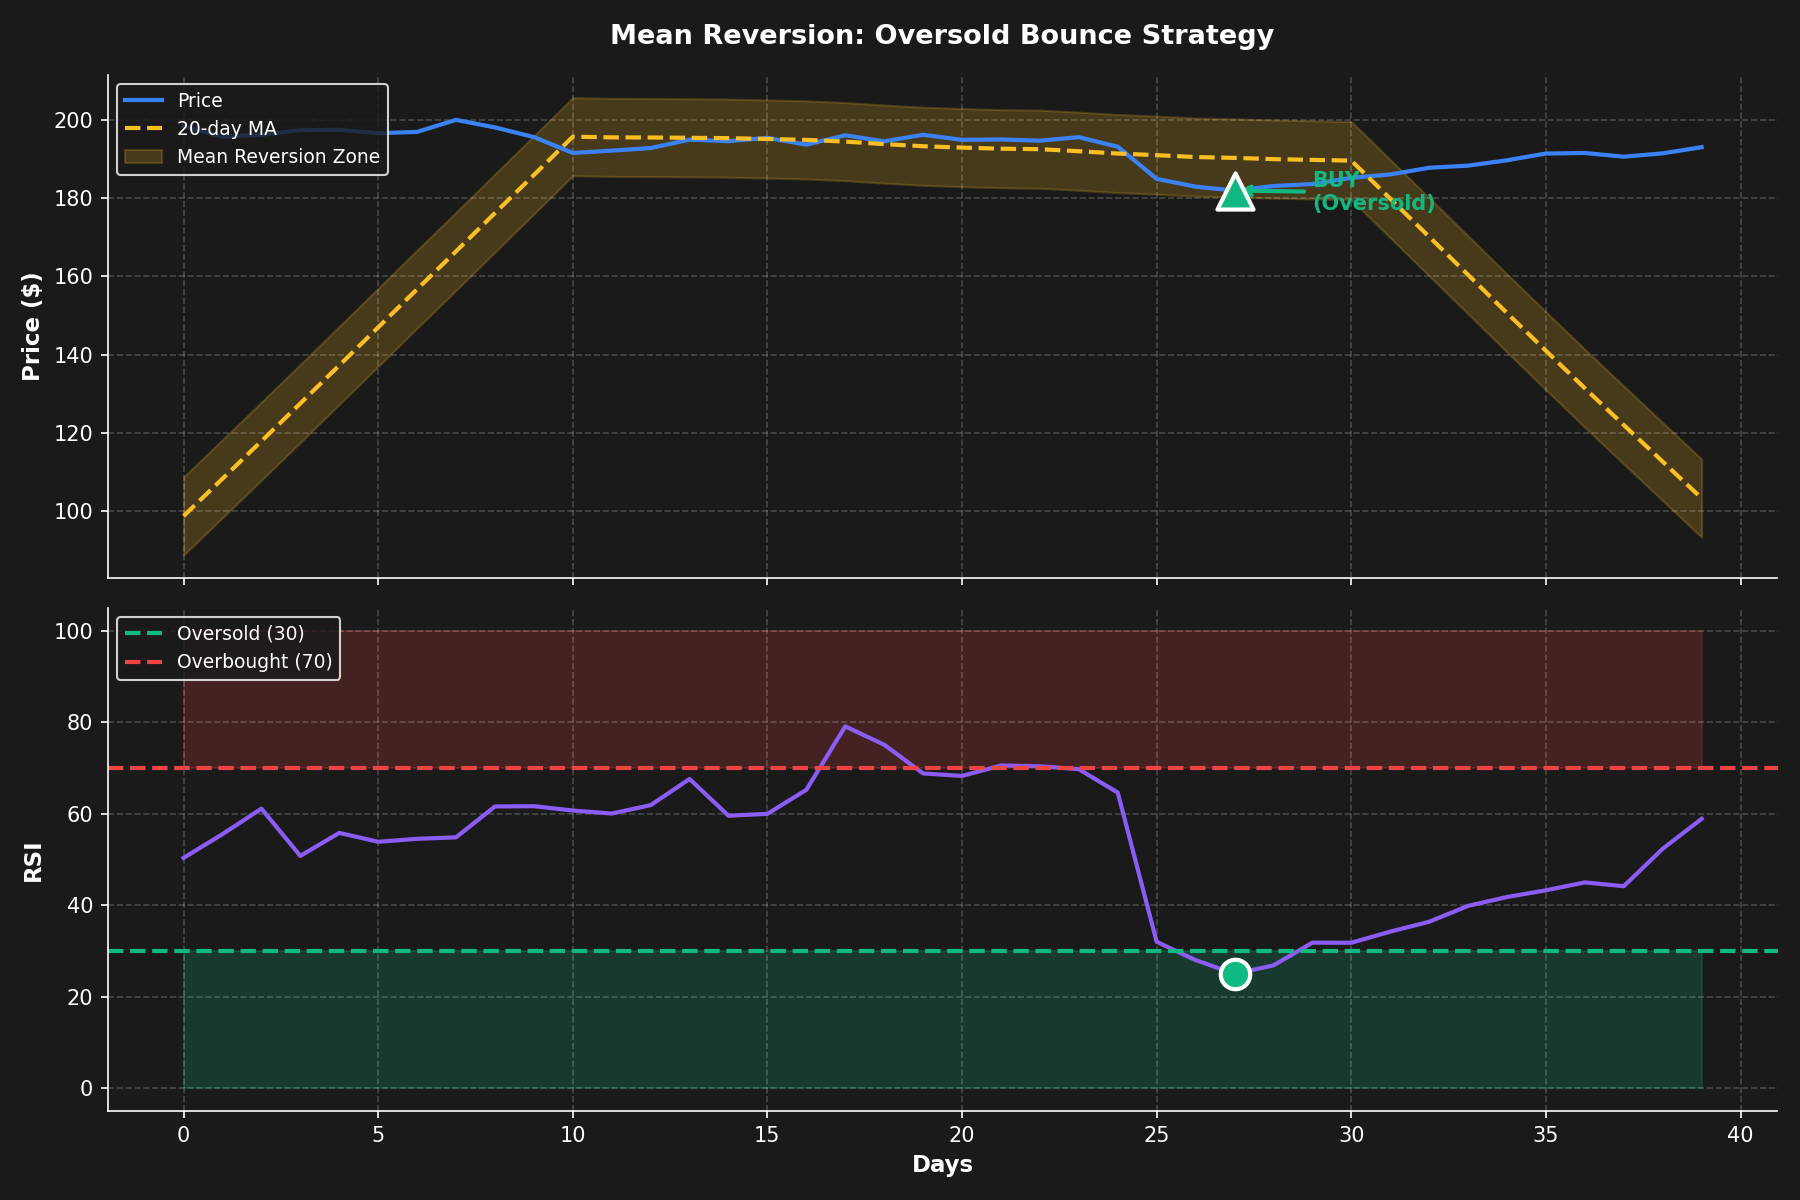
Price drops 2+ standard deviations below 20-day MA, then bounces back to the mean. Classic mean reversion setup.
When Mean Reversion Works
Ideal Market Conditions
- Range-bound markets (no strong trend)
- Low volatility environments (VIX < 20)
- Liquid stocks with tight spreads
- After panic selling or euphoric buying
- During earnings season (overreactions)
Statistical Measures
| Indicator | Oversold Signal | Overbought Signal |
|---|---|---|
| RSI (14) | < 30 | > 70 |
| Bollinger Bands | Touch lower band | Touch upper band |
| % from 20-day MA | -5% or more | +5% or more |
| Z-Score | < -2.0 | > +2.0 |
The Z-Score Method
Z-score measures how many standard deviations price is from the mean. Most powerful mean reversion indicator.
Z-Score = (Current Price - 20-day MA) / Standard Deviation
// Example: Stock at $95, MA at $100, StdDev = $2.50
Z-Score = (95 - 100) / 2.50 = -2.0
// -2.0 = Oversold, expect bounce
Entry Strategies
1. Extreme Entry
Buy when price hits extreme oversold levels. Highest risk, highest reward.
Entry: RSI < 25 AND price < lower Bollinger Band
Target: 20-day moving average
Stop: 3-5% below entry
2. Confirmation Entry
Wait for reversal signal after oversold condition. Lower risk, lower reward.
Entry: After oversold + bullish engulfing candle or hammer
Target: 20-day moving average
Stop: Below reversal candle low
3. Moving Average Bounce
Buy when price touches key MA in uptrend. Lowest risk, consistent profits.
Entry: Price touches 20-day MA in established uptrend
Target: Recent high or +3-5%
Stop: Below MA or -2%
Real Example: AAPL Oversold Bounce (Nov 2025)
Setup: AAPL dropped from $185 to $172 in 5 days (-7%)
Signals: RSI = 24, Z-Score = -2.3, touched lower BB
Entry: $172.50 (confirmation: bullish hammer)
Target: $180 (20-day MA)
Stop: $168 (-2.6%)
Result: Hit target in 3 days (+4.3%)
When Mean Reversion Fails
Mean reversion is dangerous in trending markets. Avoid these conditions:
| Danger Zone | Why It Fails |
|---|---|
| Strong downtrend | Catching falling knives - oversold gets more oversold |
| High volatility (VIX > 30) | Extreme moves continue, no reversion |
| News-driven moves | Fundamental change, not statistical anomaly |
| Earnings surprises | New price level justified, no reversion |
| Breakout/breakdown | Trend beginning, not ending |
Risk Management
Mean Reversion Position Sizing
Conservative: Risk 0.5% per trade (higher win rate, smaller moves)
Moderate: Risk 1% per trade (balanced approach)
Aggressive: Risk 1.5% per trade (extreme setups only)
Mean reversion has 60-70% win rate but smaller R:R (1:1 to 1:2). Size accordingly.
Time Horizon
Mean reversion trades are typically short-term:
- Intraday: 1-4 hours (scalping oversold bounces)
- Swing: 1-5 days (most common timeframe)
- Position: 1-2 weeks (MA touch to MA touch)
Exit when price reaches the mean. Don't overstay - reversion complete.
Advanced: Pairs Trading
Trade mean reversion between correlated stocks:
- Find two highly correlated stocks (correlation > 0.8)
- Calculate the spread (Stock A - Stock B)
- When spread reaches 2+ standard deviations:
- Long the underperformer
- Short the outperformer
- Exit when spread returns to mean
Bollinger Band Strategy
Classic mean reversion setup using Bollinger Bands (20-day MA, 2 standard deviations):
Long Setup:
- Price touches or breaks below lower band
- RSI < 30 (confirmation)
- Wait for close back inside bands
- Enter next day at open
- Target: Middle band (20-day MA)
- Stop: Below lower band or -3%
Market Regime Filter
Only trade mean reversion in the right market environment:
| Market Type | Mean Reversion Edge | Action |
|---|---|---|
| Range-bound | Strong | Trade aggressively |
| Weak trend | Moderate | Trade selectively |
| Strong trend | Weak/None | Avoid or reverse strategy |
Profit Taking Strategy
Mean reversion trades have defined targets. Don't get greedy:
- Scale out at MA: Take 50% off at 20-day MA
- Trail remaining: Move stop to breakeven, let runner go
- Full exit at opposite extreme: If RSI hits 70, exit all
- Time stop: If no reversion in 5 days, exit
Common Mistakes
- Fighting strong trends: Don't buy oversold in downtrends
- No stop loss: "It has to bounce" - famous last words
- Holding past target: Exit at the mean, don't hope for more
- Ignoring market regime: Mean reversion fails in trending markets
- Oversizing positions: Smaller R:R requires smaller position sizes
Mean Reversion Checklist
Before entering mean reversion trade:
- ✓ Market in range or weak trend (not strong trend)
- ✓ VIX < 25 (low to moderate volatility)
- ✓ RSI < 30 (oversold) or > 70 (overbought)
- ✓ Price 2+ standard deviations from mean
- ✓ No major news or earnings catalyst
- ✓ Clear target (moving average) identified
- ✓ Stop loss 2-3% from entry
- ✓ Position size accounts for lower R:R
Performance Expectations
Typical Mean Reversion Stats:
- Win Rate: 60-70%
- Average Win: 3-5%
- Average Loss: 2-3%
- Risk:Reward: 1:1.5 to 1:2
- Hold Time: 1-5 days
- Expectancy: Positive in range-bound markets
Key Takeaways
- Mean reversion works best in range-bound, low volatility markets
- Use Z-score or Bollinger Bands to identify extremes
- Target the mean (moving average), exit when reached
- Avoid mean reversion in strong trends - trend is your friend
- Higher win rate but lower R:R than trend following
- Keep stops tight (2-3%) and position sizes moderate
- Time stop: Exit if no reversion within 5 days
Scan for Mean Reversion Setups with MarketDly
Get alerts when stocks hit statistical extremes ready to revert
Start Free Trial