Volume Profile & Point of Control Trading
Learn how institutional traders use Volume Profile and POC to identify high-probability support/resistance zones where the most trading activity occurred.
What is Volume Profile?
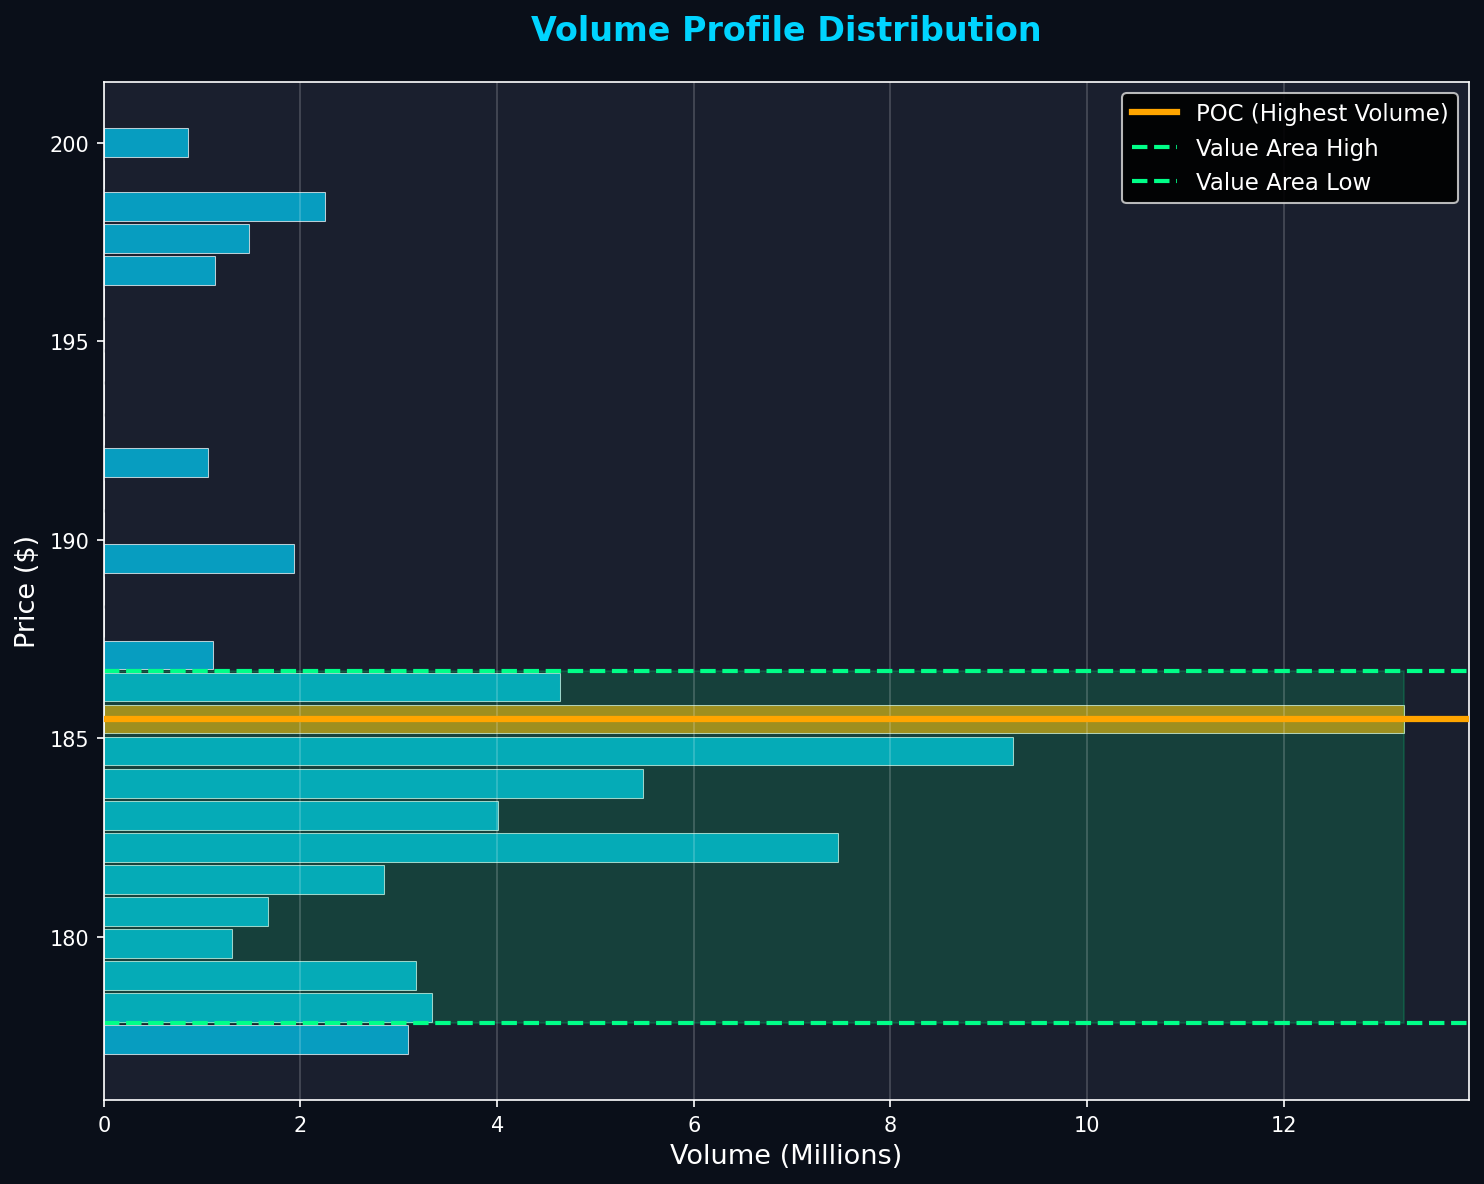
Volume Profile displays trading activity horizontally across price levels, showing where the most volume traded. Unlike traditional volume bars (which show volume over time), Volume Profile shows volume at price - revealing where institutions accumulated or distributed positions.
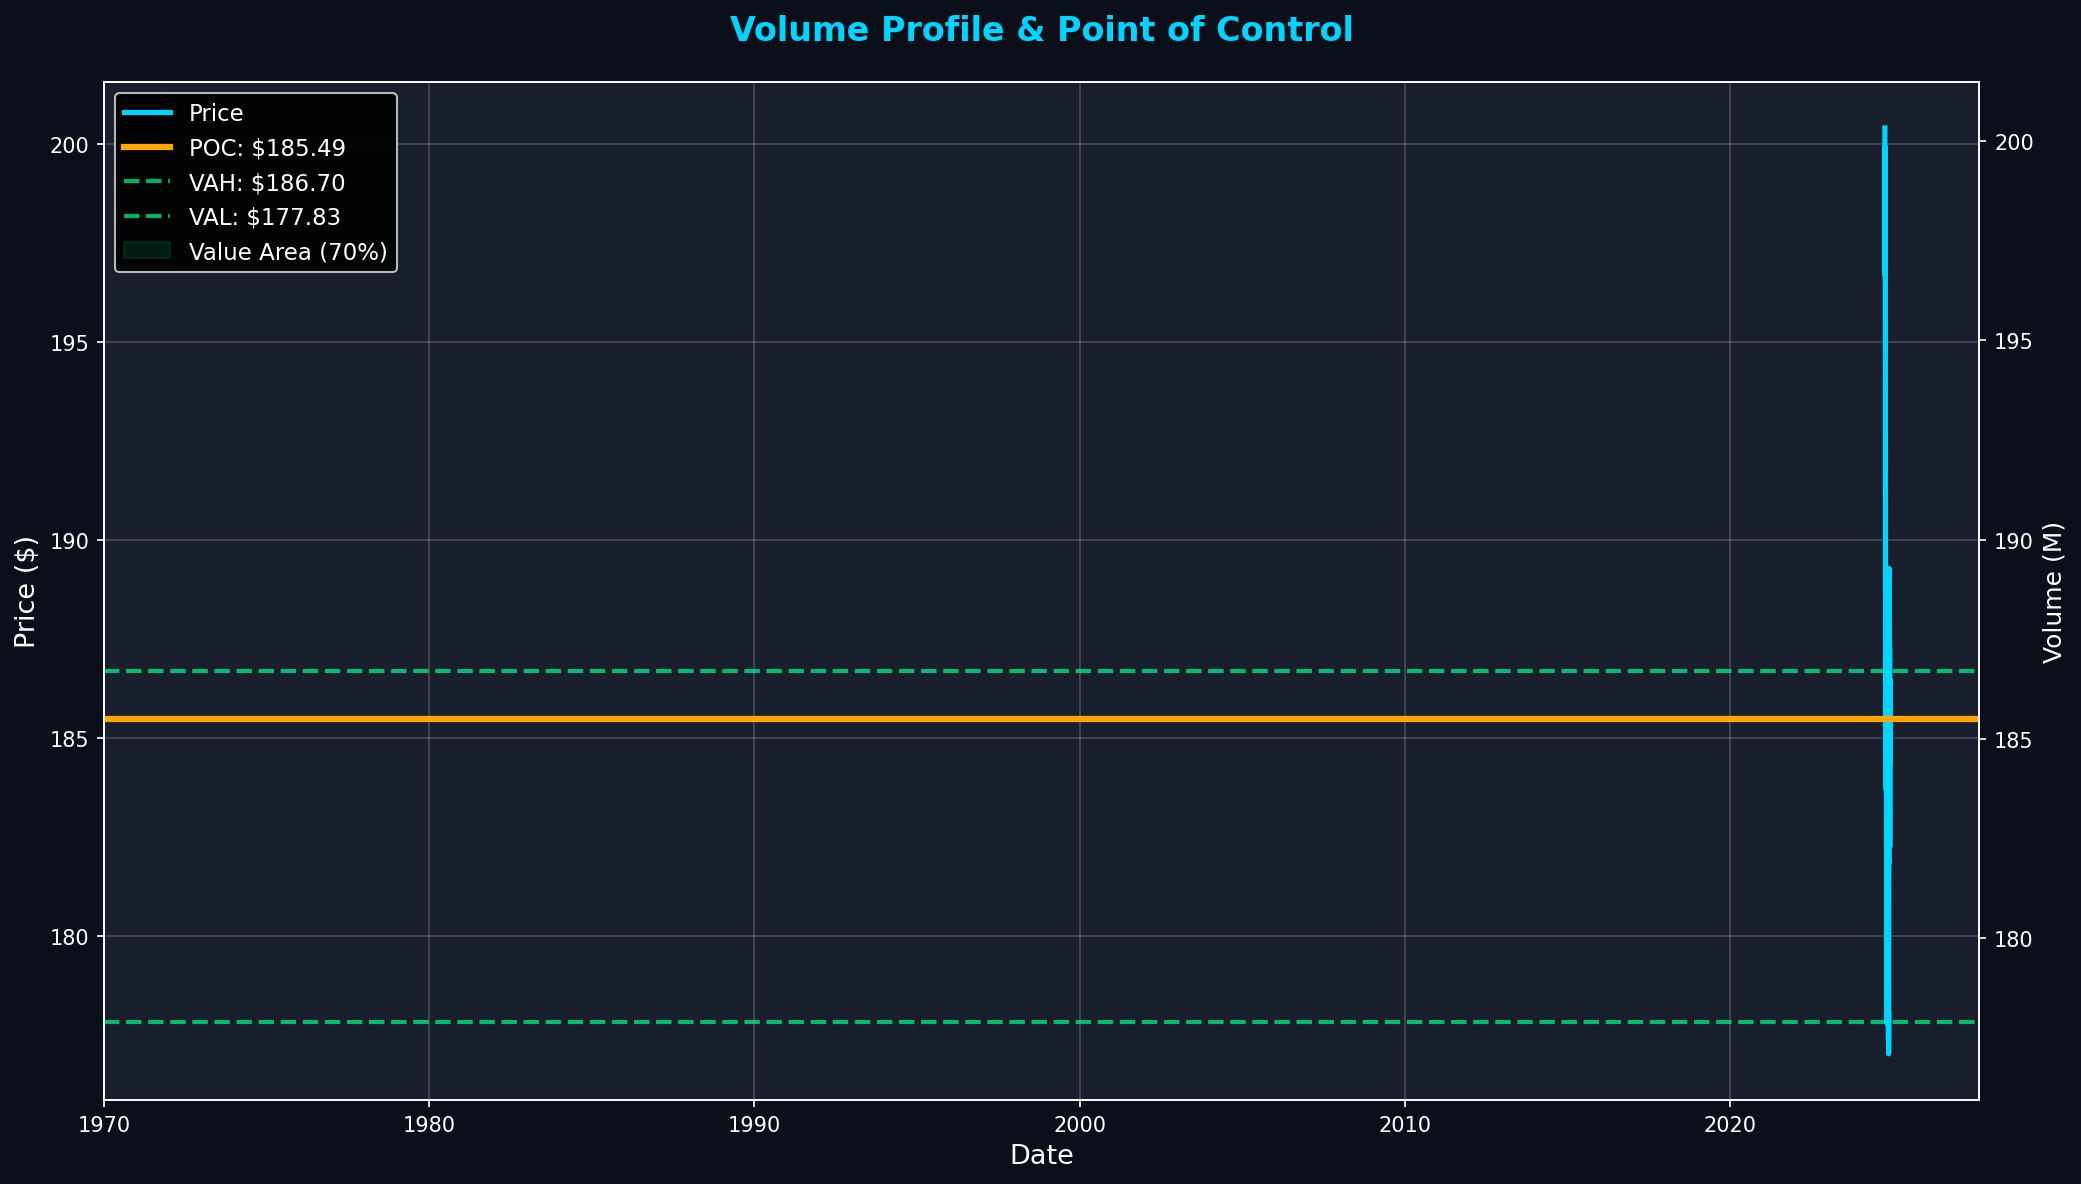
The Point of Control (POC) is the price level with the highest volume - the most accepted price where buyers and sellers agreed most. POC acts as a magnet, pulling price back when it moves away.
Key Insight: Price tends to return to POC 70% of the time. When price is far from POC, expect mean reversion. When price breaks through POC with volume, expect continuation.
Key Components
1. Point of Control (POC)
The price level with highest volume:
- Acts as magnet: Price gravitates toward POC
- Support/Resistance: POC becomes key level
- Fair value: Most accepted price by market
2. Value Area (VA)
Price range containing 70% of volume:
- VAH (Value Area High): Upper boundary of value
- VAL (Value Area Low): Lower boundary of value
- Inside VA: Fair value zone, choppy trading
- Outside VA: Unfair value, trending moves
3. High Volume Nodes (HVN)
Price levels with high volume concentration:
- Strong support/resistance
- Price consolidates at HVN
- Difficult to break through
4. Low Volume Nodes (LVN)
Price levels with low volume:
- Weak support/resistance
- Price moves quickly through LVN
- Gaps often form at LVN
Trading Strategies
Strategy 1: POC Reversion
Trade price returning to POC:
- Setup: Price 5%+ away from POC
- Entry: Price starts moving toward POC
- Target: POC level
- Stop: Beyond recent swing
Strategy 2: VA Breakout
Trade breakouts from value area:
- Setup: Price consolidating in VA
- Entry: Break above VAH or below VAL with volume
- Target: Next HVN or previous VA
- Stop: Back inside VA
Strategy 3: HVN Bounce
Trade bounces at high volume nodes:
- Setup: Price approaching HVN
- Entry: Reversal candle at HVN
- Target: POC or opposite VA boundary
- Stop: Below HVN
Strategy 4: LVN Gap Fill
Trade rapid moves through low volume nodes:
- Setup: Price at edge of LVN
- Entry: Momentum candle entering LVN
- Target: Next HVN on other side
- Stop: Tight, LVN offers little support
Key Takeaways
- •Volume Profile shows where institutions traded, revealing true support/resistance
- •POC is the most accepted price - acts as magnet for mean reversion
- •Value Area (70% of volume) defines fair value range
- •HVN = strong support/resistance, LVN = weak (price moves fast)
- •Trade POC reversion when price is 5%+ away
- •VA breakouts with volume lead to trending moves
Get Volume Profile Analysis
MarketDly provides Volume Profile analysis for key stocks, identifying POC, value areas, and institutional zones.
View Pricing PlansReady to Put This Into Practice?
Join MarketDly to access real-time market insights, AI-powered analysis, and professional trading tools.
No credit card required • Free tier available • Upgrade anytime