MACD Histogram Divergence: Predicting Reversals
Learn how MACD histogram divergence predicts trend reversals before price confirms. Master regular and hidden divergence patterns for high-probability entries.
What is MACD Divergence?
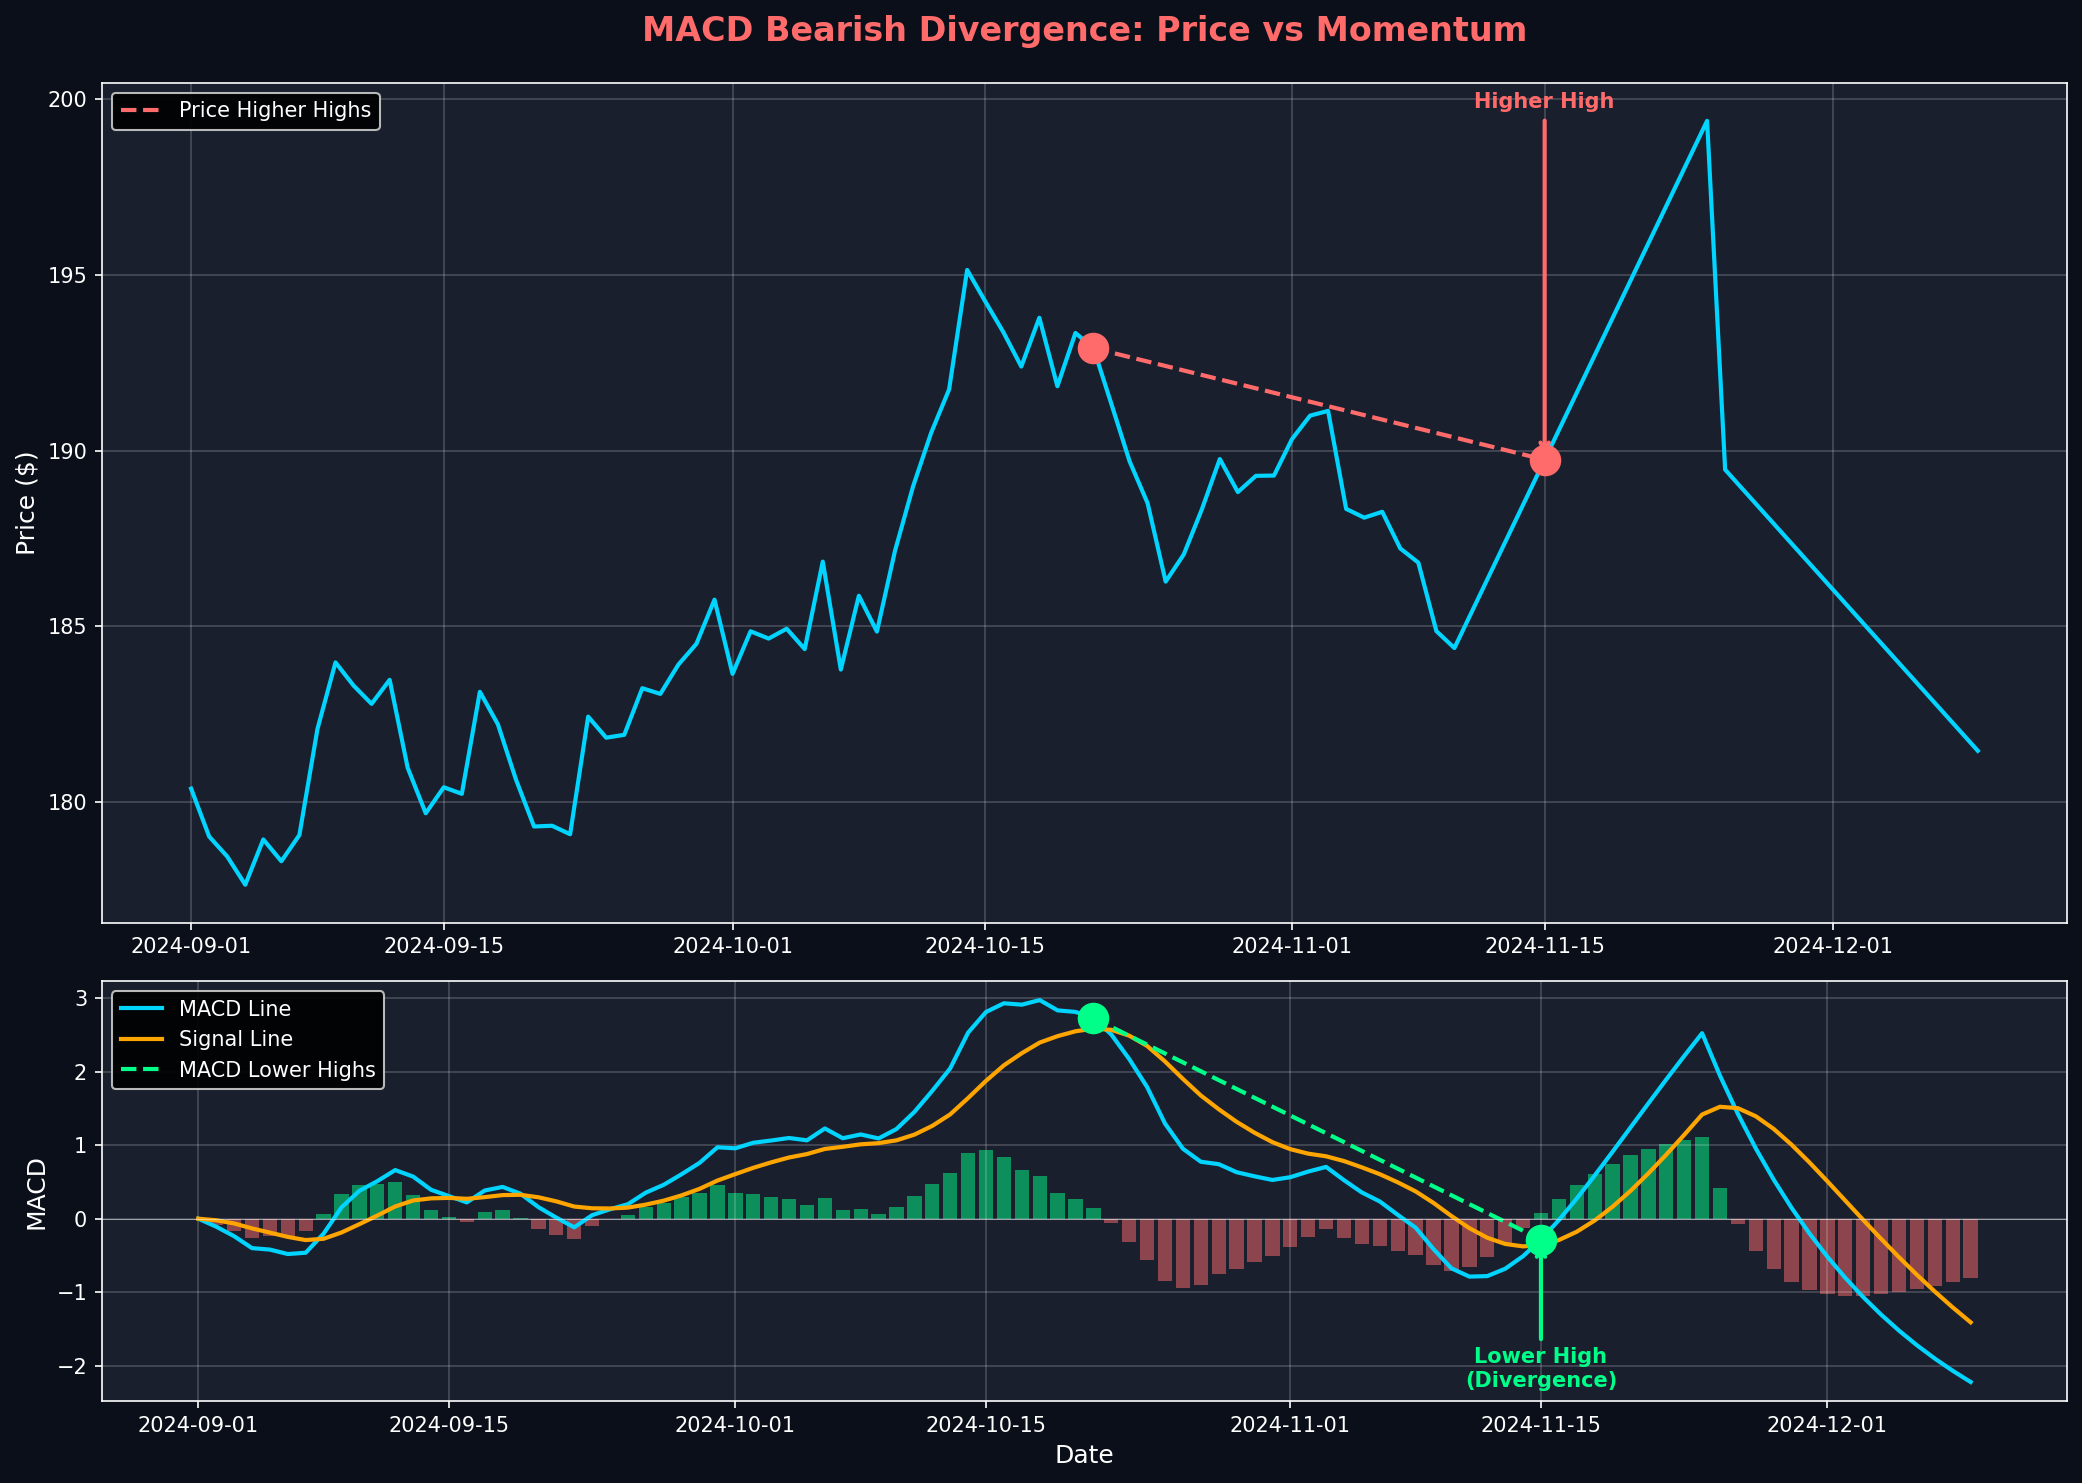
MACD (Moving Average Convergence Divergence) divergence occurs when price makes a new high or low, but the MACD indicator fails to confirm it. This signals weakening momentum and an impending reversal.
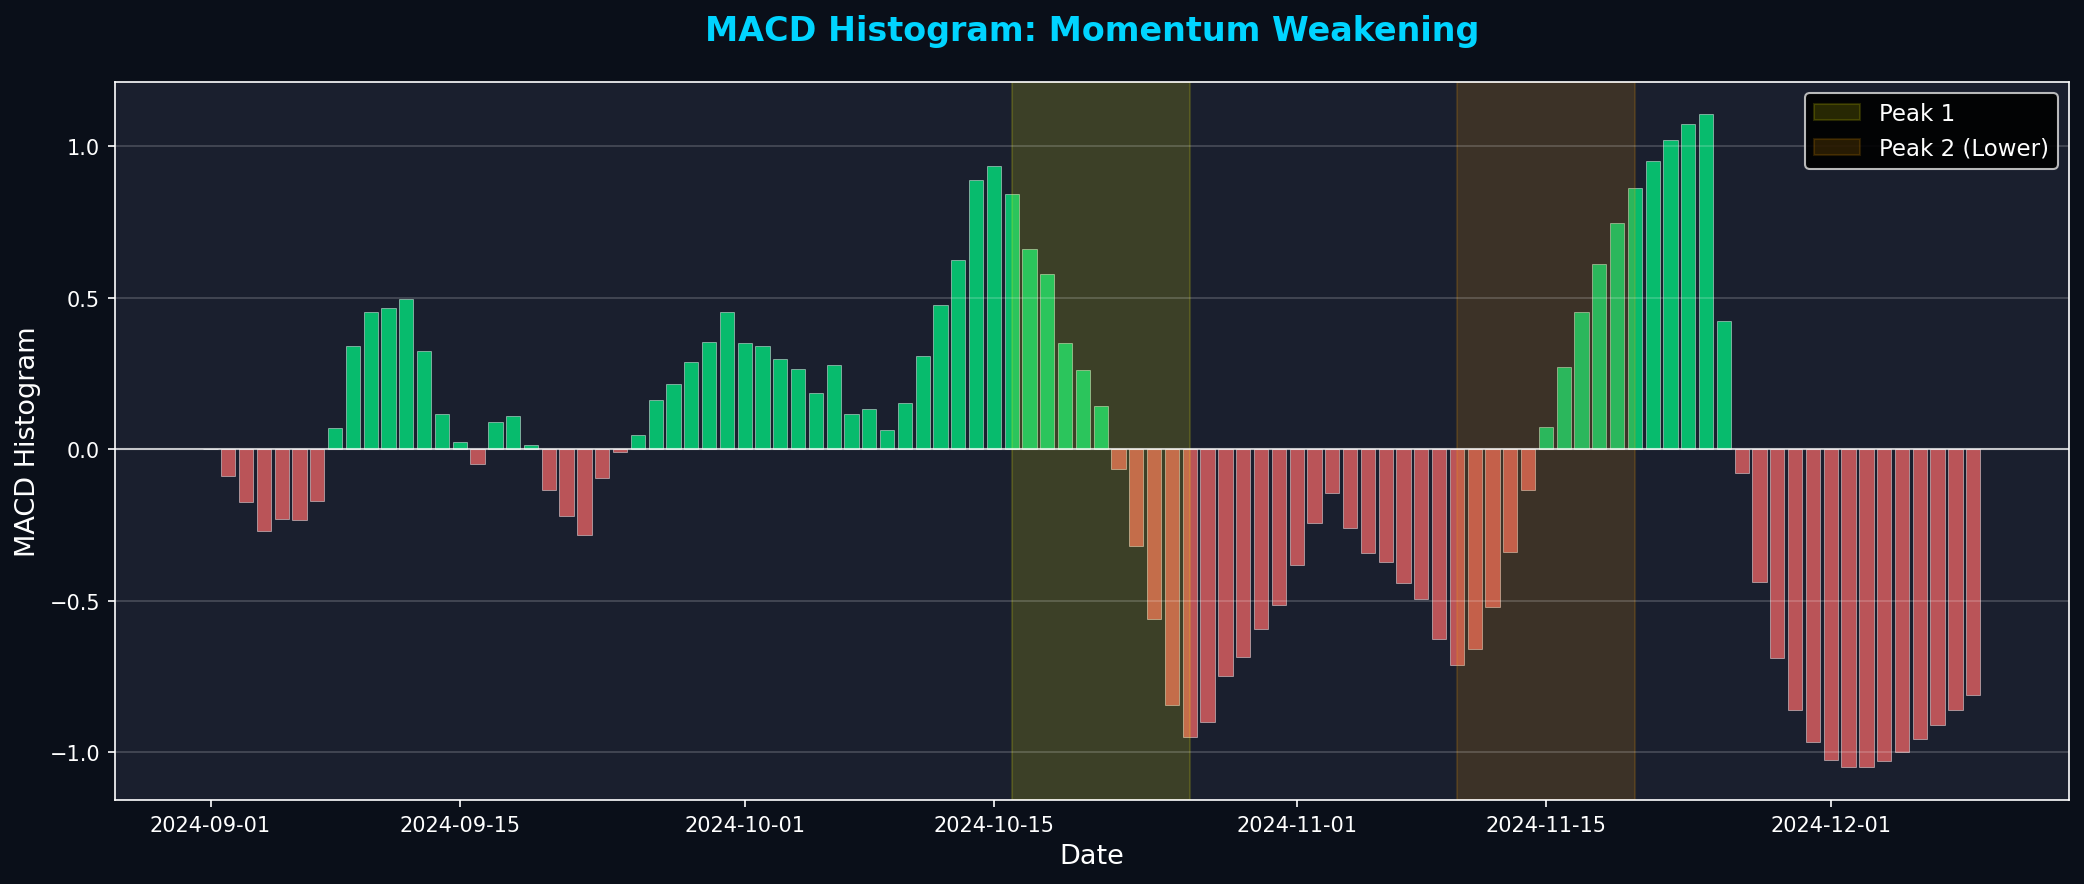
The MACD histogram (the difference between MACD line and signal line) is the most sensitive component for spotting divergences early. When the histogram makes lower highs while price makes higher highs, it's a bearish divergence - a warning that the uptrend is losing steam.
Key Insight: Divergence doesn't predict exact timing, but it identifies high-probability reversal zones. Combine with support/resistance for precise entries.
MACD Formula & Components
Understanding the MACD calculation helps you interpret divergences correctly:
MACD Line (12, 26)
Difference between 12-period and 26-period exponential moving averages
Signal Line (9)
9-period EMA of the MACD line, acts as trigger line
Histogram
Visual representation of distance between MACD and signal line
Types of Divergence
1. Regular Bearish Divergence
Signals trend reversal from up to down:
- Price: Makes higher high
- MACD: Makes lower high
- Interpretation: Uptrend losing momentum, reversal likely
- Action: Look for short entries or exit longs
2. Regular Bullish Divergence
Signals trend reversal from down to up:
- Price: Makes lower low
- MACD: Makes higher low
- Interpretation: Downtrend losing momentum, reversal likely
- Action: Look for long entries or exit shorts
3. Hidden Bullish Divergence
Signals trend continuation (uptrend):
- Price: Makes higher low
- MACD: Makes lower low
- Interpretation: Pullback in uptrend, continuation likely
- Action: Buy the dip
4. Hidden Bearish Divergence
Signals trend continuation (downtrend):
- Price: Makes lower high
- MACD: Makes higher high
- Interpretation: Rally in downtrend, continuation likely
- Action: Short the rally
Trading MACD Divergence
Entry Rules
- Identify Divergence: Price and MACD moving in opposite directions
- Wait for Confirmation: MACD line crosses signal line in reversal direction
- Price Confirmation: Price breaks support (bearish) or resistance (bullish)
- Volume Check: Volume increases on reversal move
- Enter: On confirmation candle close
Stop Loss Placement
- Bearish Divergence: Stop above recent swing high
- Bullish Divergence: Stop below recent swing low
- Typical Risk: 2-4% from entry
Profit Targets
- Target 1: Previous swing low/high (1:1 R/R)
- Target 2: Next major support/resistance (2:1 R/R)
- Target 3: MACD crosses back (trend exhaustion)
Common Mistakes
- Trading Without Confirmation: Divergence alone isn't enough. Wait for price and MACD confirmation.
- Ignoring Trend: Divergences in strong trends often fail. Trade with the trend when possible.
- Wrong Timeframe: Use daily charts for swing trades. Intraday divergences produce false signals.
- No Stop Loss: Divergences can extend. Always use stops.
- Forcing Divergences: Not every high/low creates divergence. Be selective.
Key Takeaways
- •MACD divergence predicts reversals by showing momentum weakness
- •Regular divergence = trend reversal, Hidden divergence = trend continuation
- •Histogram is most sensitive for early divergence detection
- •Wait for MACD crossover + price confirmation before entering
- •Use daily charts for reliability, avoid intraday noise
- •Combine with support/resistance for precise entry timing
Get Real-Time Divergence Alerts
MarketDly scans 500+ stocks daily for MACD divergence patterns. Get alerts when momentum weakens before price reverses.
View Pricing PlansReady to Put This Into Practice?
Join MarketDly to access real-time market insights, AI-powered analysis, and professional trading tools.
No credit card required • Free tier available • Upgrade anytime