Fibonacci Retracement & Extension Trading
Master Fibonacci levels based on the golden ratio for precise pullback entries and profit targets. Learn why 61.8% and 161.8% levels work across all markets.
The Golden Ratio in Markets
Fibonacci retracements are based on the golden ratio (φ = 1.618), a mathematical constant found throughout nature, architecture, and financial markets. When trends pull back, they often retrace to Fibonacci levels before continuing.
The key levels - 23.6%, 38.2%, 50%, 61.8%, and 78.6% - represent natural retracement zones where buyers (in uptrends) or sellers (in downtrends) are likely to step in. The 61.8% level, derived directly from the golden ratio, is the most powerful.
Key Insight: Fibonacci works because traders worldwide use it, creating self-fulfilling prophecies. When millions watch the same levels, they become real support/resistance.
The Golden Ratio Math
Understanding where Fibonacci numbers come from:
Fibonacci Sequence
Each number = sum of previous two
Example: 3 + 5 = 8, 5 + 8 = 13, 8 + 13 = 21
Golden Ratio (φ)
Derived from: lim(n→∞) Fib(n+1) / Fib(n)
Example: 89/55 = 1.618, 144/89 = 1.618
- 1 / φ = 0.618 (61.8% retracement)
- 1 / φ² = 0.382 (38.2% retracement)
- √(1/φ) = 0.786 (78.6% retracement)
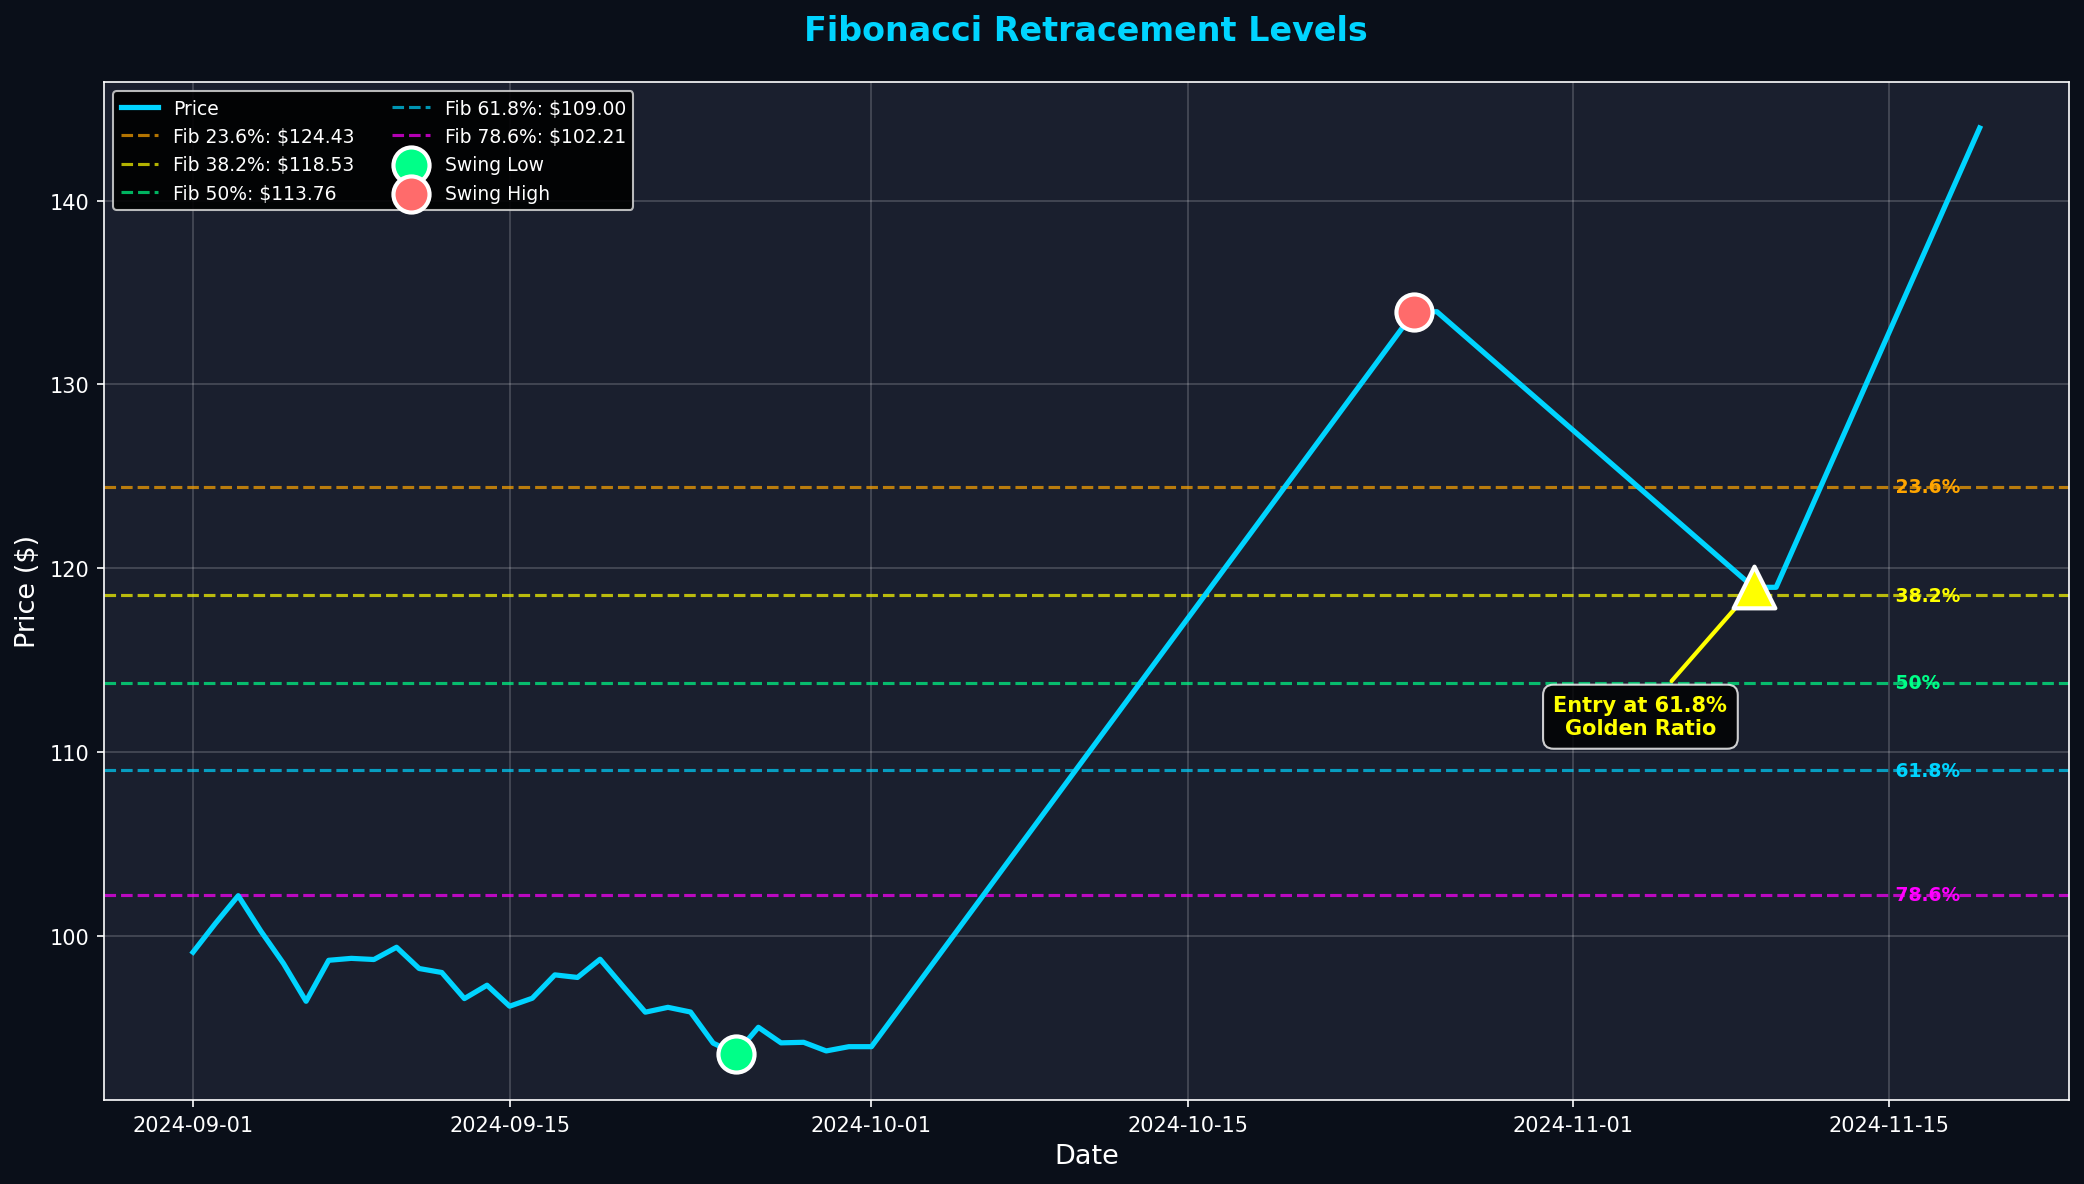
Retracement Calculation
Range = High - Low
Example: High $150, Low $100, Range $50
- 23.6%: $150 - ($50 × 0.236) = $138.20
- 38.2%: $150 - ($50 × 0.382) = $130.90
- 50.0%: $150 - ($50 × 0.500) = $125.00
- 61.8%: $150 - ($50 × 0.618) = $119.10
- 78.6%: $150 - ($50 × 0.786) = $110.70
Fibonacci Retracement Levels
23.6% - Shallow Retracement
- Meaning: Very strong trend, minimal pullback
- Use: Aggressive entries in powerful trends
- Risk: Often breaks through, not reliable alone
38.2% - Moderate Retracement
- Meaning: Healthy pullback in strong trend
- Use: First entry zone for trend continuation
- Confluence: Combine with moving averages
50% - Psychological Level
- Meaning: Not a Fibonacci number, but widely watched
- Use: Midpoint of range, strong support/resistance
- Psychology: Traders naturally think in halves
61.8% - The Golden Ratio ⭐
- Meaning: Most important Fibonacci level
- Use: Primary entry zone for pullback trades
- Success Rate: Highest probability of reversal
- Stop Loss: Place just below this level
78.6% - Deep Retracement
- Meaning: Last chance for trend continuation
- Use: Final support before trend reversal
- Warning: Break below = trend likely over
Fibonacci Extensions
Extensions project profit targets beyond the original move:
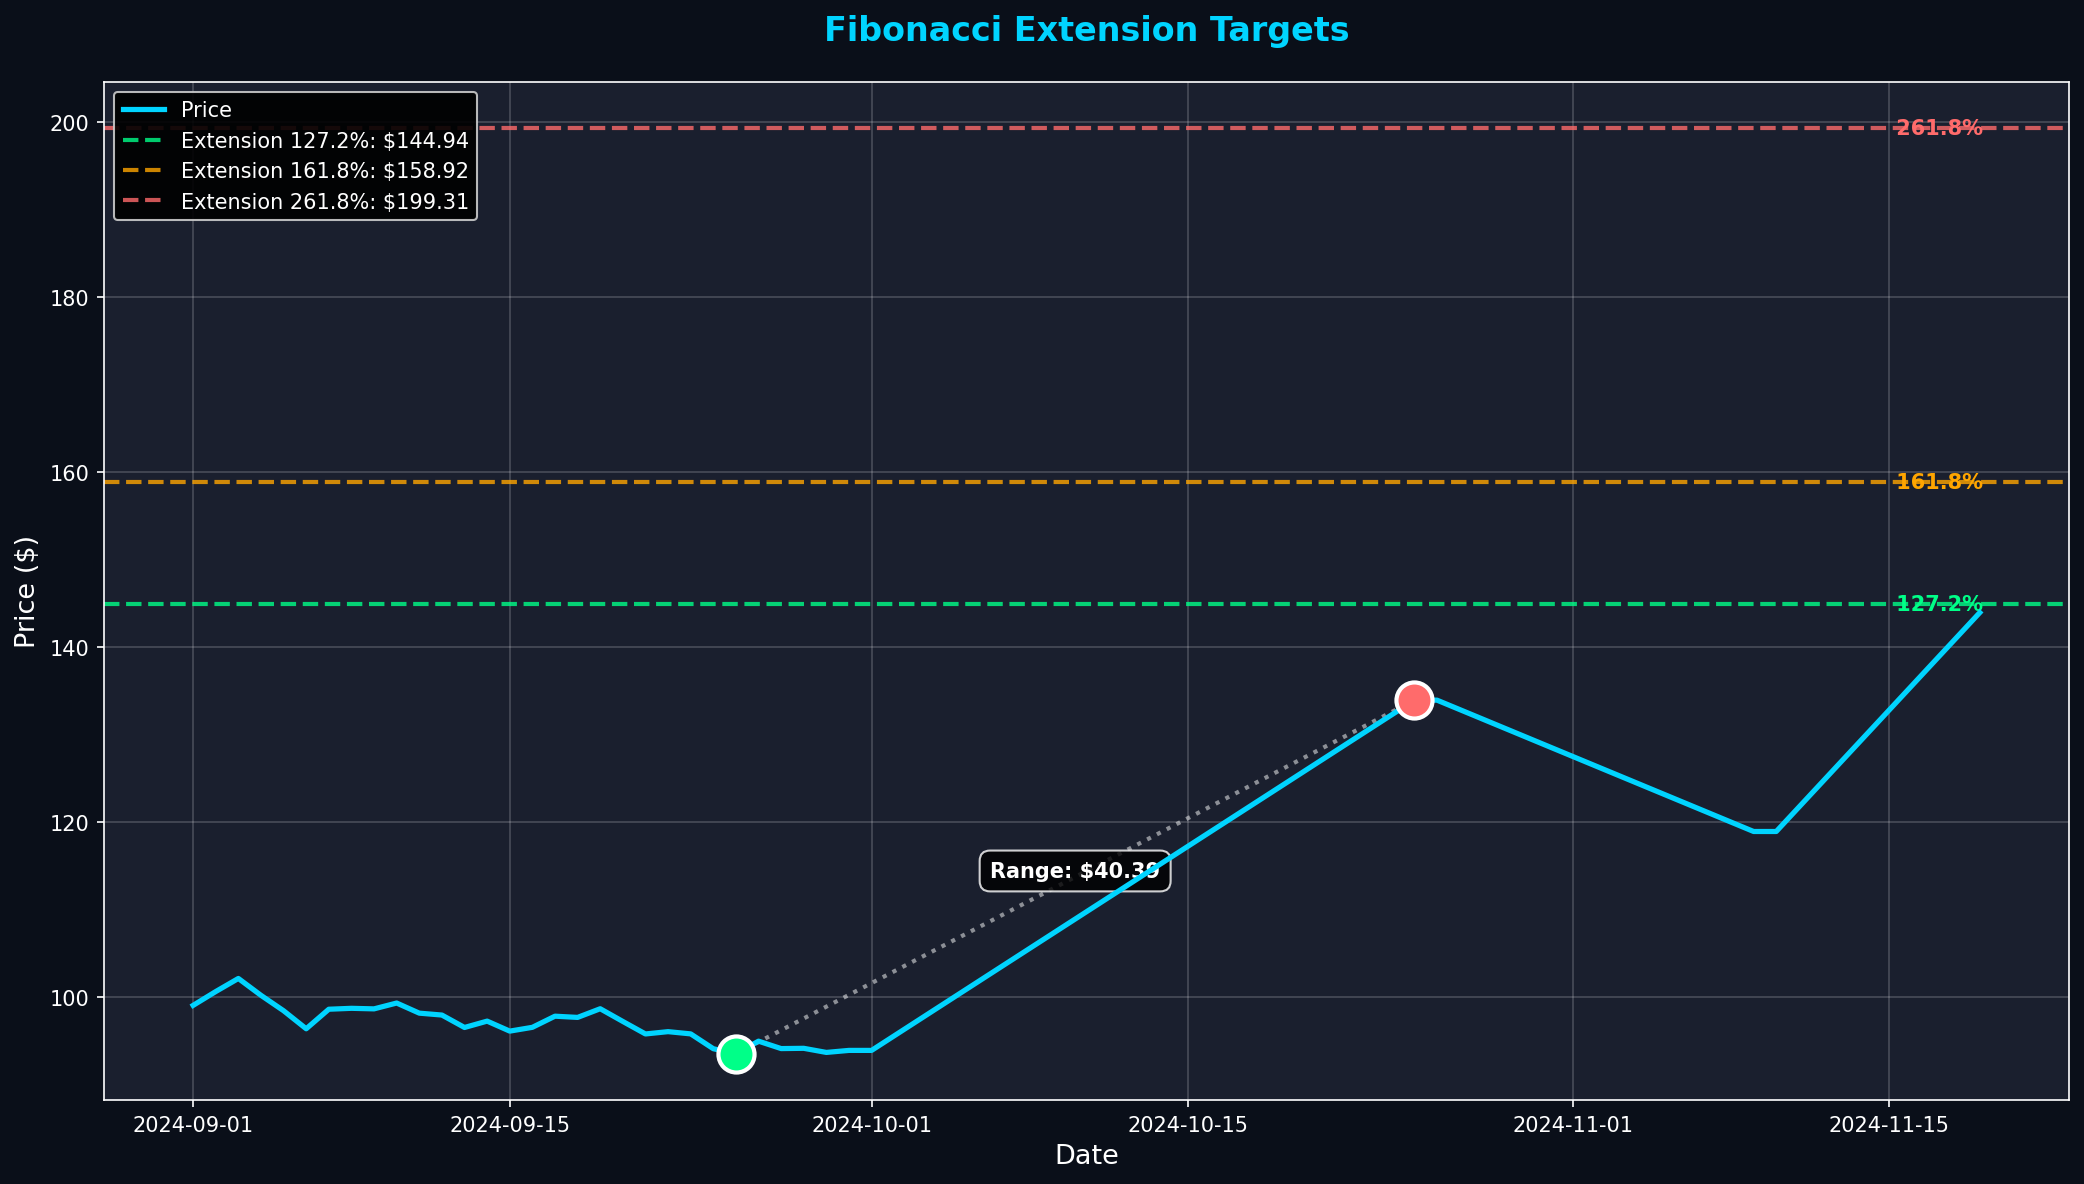
127.2% Extension
- Conservative first target
- Take 25-33% profits here
- Often reached in trending markets
161.8% Extension ⭐
- Primary profit target (golden ratio)
- Most commonly reached extension
- Take 50% profits at this level
261.8% Extension
- Extended target for strong trends
- Rarely reached, but powerful when it hits
- Trail stops, don't wait for this level
Trading Strategy
Entry Rules
- Identify Trend: Clear uptrend or downtrend with swing high/low
- Draw Fibonacci: From swing low to swing high (uptrend)
- Wait for Pullback: Price retraces toward Fib levels
- Watch 61.8%: Primary entry zone, look for reversal signals
- Confirm: Bullish candle + volume at Fib level
- Enter: On confirmation candle close
Stop Loss Placement
- Conservative: Below 78.6% level
- Aggressive: Below 61.8% level (tighter stop)
- Typical Risk: 2-4% from entry
Profit Targets
- Target 1: Previous swing high (1:1 R/R)
- Target 2: 127.2% extension (take 25%)
- Target 3: 161.8% extension (take 50%)
- Trail: Remaining position with 50% Fib of new swing
Confluence Trading
Fibonacci works best when combined with other indicators:
Fib + Moving Averages
- 61.8% level aligns with 50-day MA = high probability
- 38.2% level aligns with 20-day MA = aggressive entry
- Both provide dynamic support confirmation
Fib + Support/Resistance
- Fib level at previous support = strong confluence
- Multiple Fib levels cluster = major zone
- Round numbers + Fib = psychological strength
Fib + Volume Profile
- 61.8% at POC = institutional support
- Fib level at HVN = high probability bounce
- Fib level at LVN = expect quick move through
Common Mistakes
- Wrong Swing Points: Use obvious highs/lows that everyone sees. Obscure swings don't work.
- No Confirmation: Don't buy at Fib level blindly. Wait for reversal candle + volume.
- Ignoring Trend: Fibonacci works best in trending markets. Avoid in choppy consolidation.
- Too Many Levels: Focus on 38.2%, 50%, and 61.8%. Don't clutter chart with every level.
- Forcing Fits: Not every pullback hits Fib levels. Be patient.
Key Takeaways
- •Fibonacci levels based on golden ratio (φ = 1.618) found throughout nature and markets
- •61.8% is the most important retracement level for pullback entries
- •161.8% extension is primary profit target (golden ratio projection)
- •Draw from obvious swing low to swing high (uptrend) or high to low (downtrend)
- •Wait for confirmation: reversal candle + volume at Fib level
- •Confluence with MA, support/resistance, or volume profile increases probability
- •Works best in trending markets, avoid during consolidation
Get Fibonacci Level Alerts
MarketDly identifies stocks pulling back to key Fibonacci levels with confluence signals for high-probability entries.
View Pricing PlansReady to Put This Into Practice?
Join MarketDly to access real-time market insights, AI-powered analysis, and professional trading tools.
No credit card required • Free tier available • Upgrade anytime