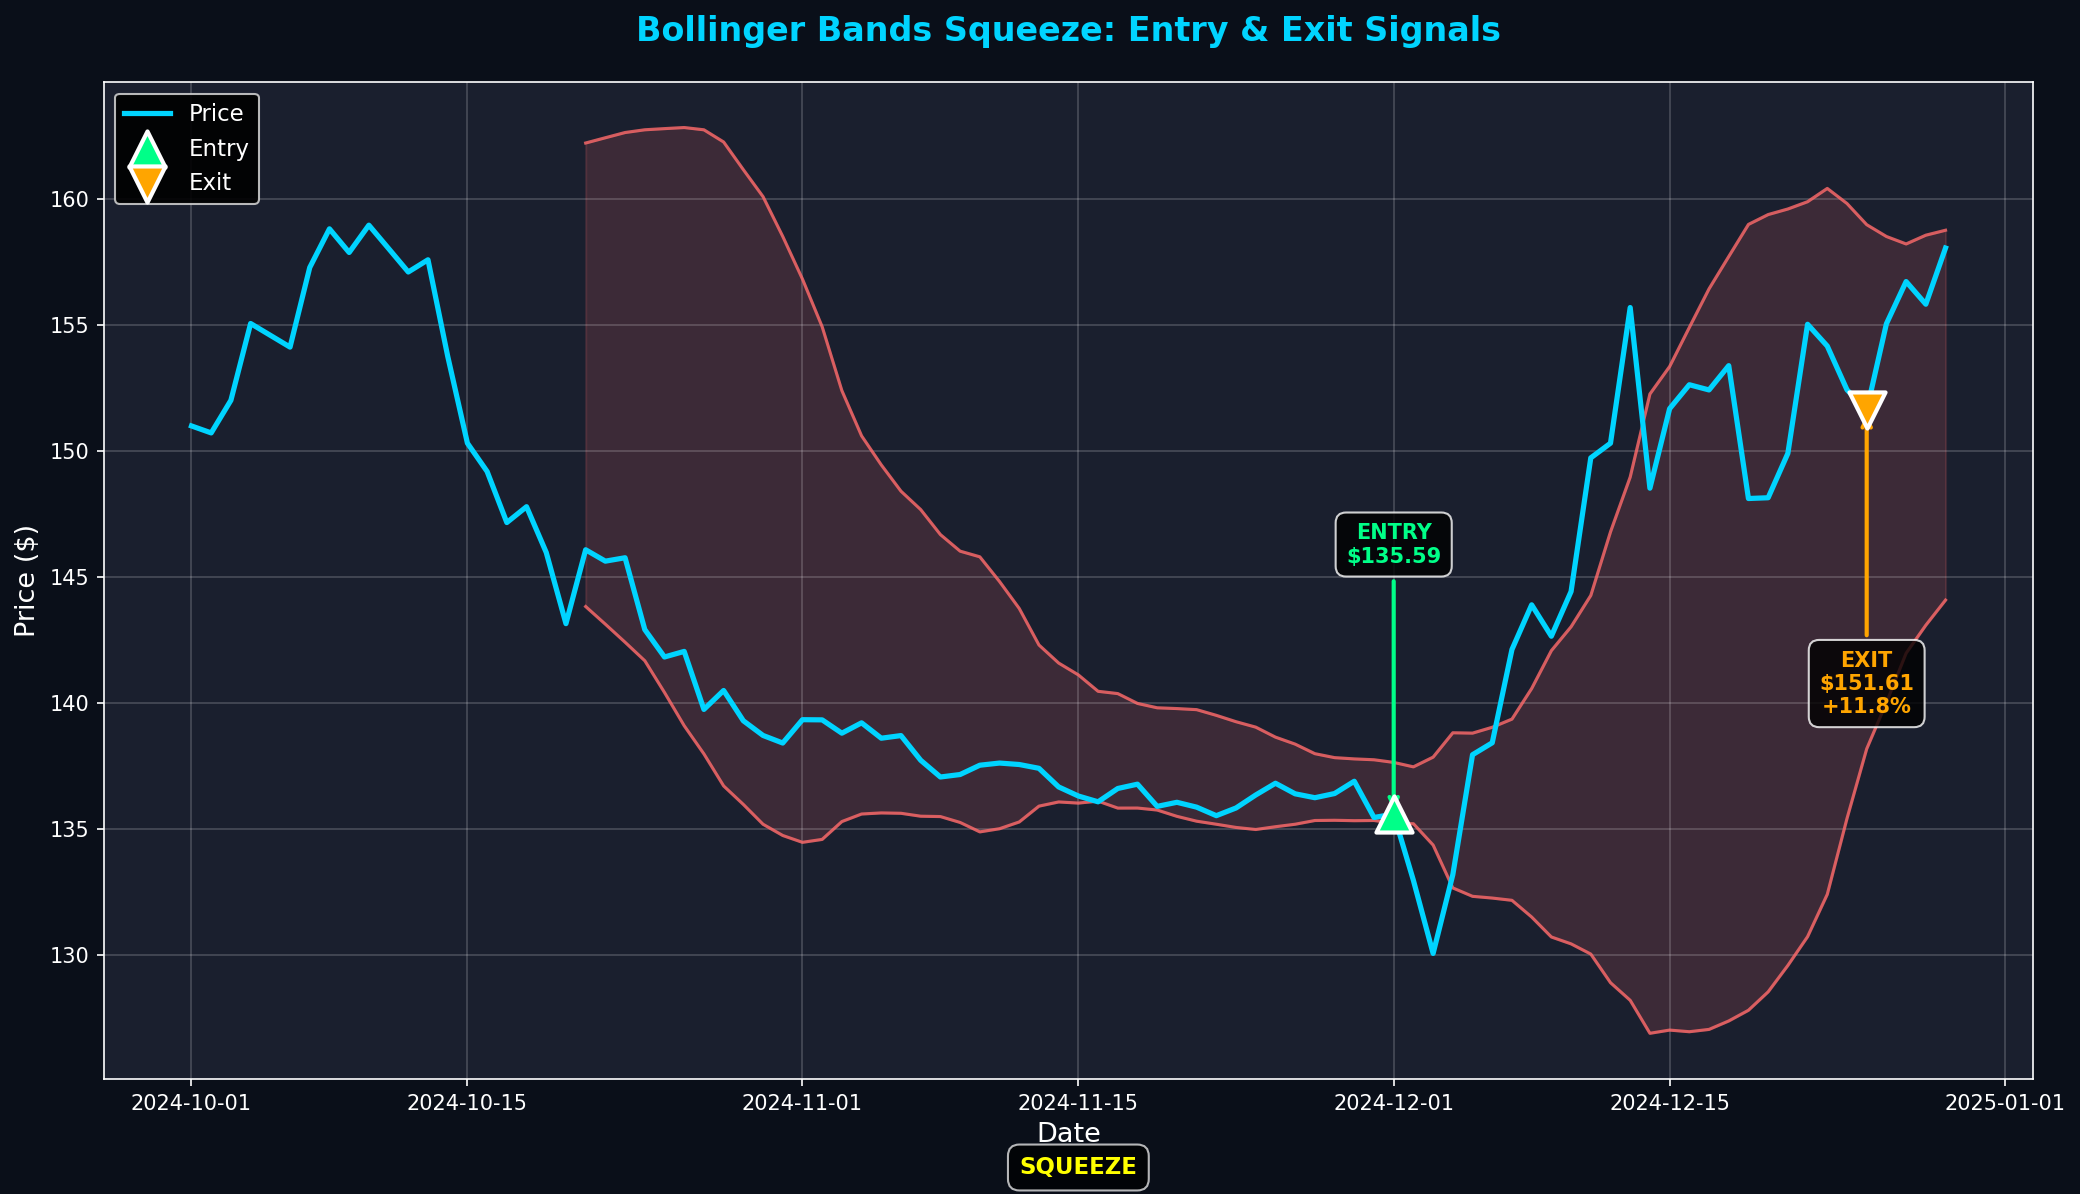
Bollinger Bands Squeeze Strategy: +11.8% in 25 Days
Real trade analysis: $135.59 → $151.61 (+11.8%) using Bollinger Bands Squeeze to catch explosive breakouts after volatility contraction
Trade Overview
What is the Bollinger Bands Squeeze?
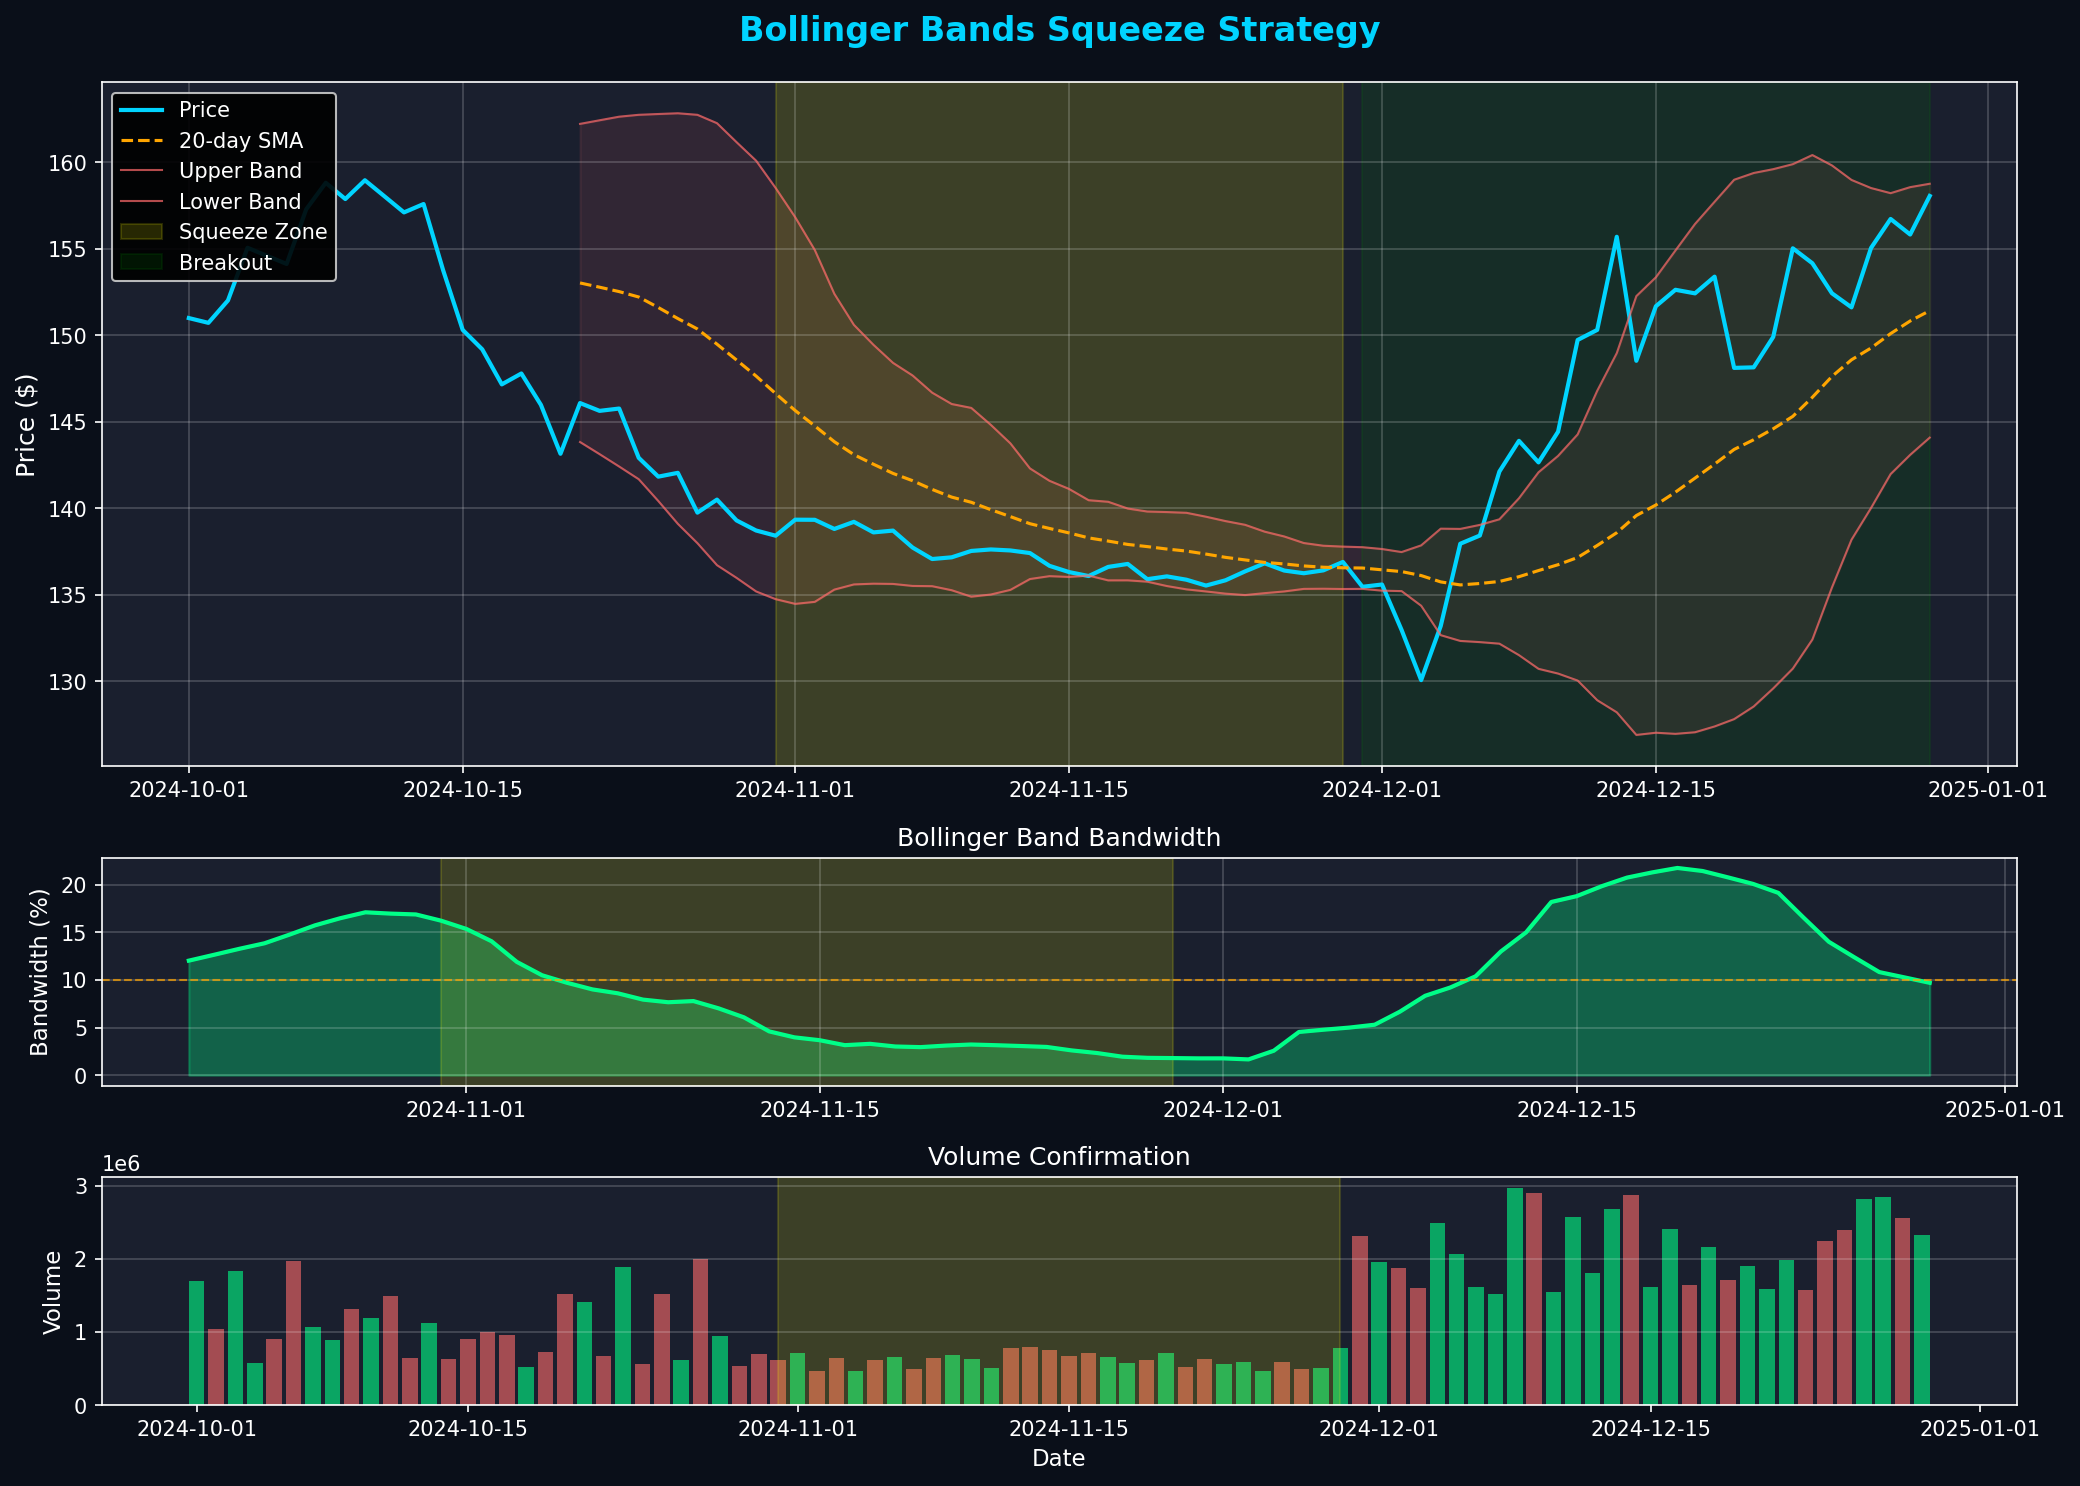
The Bollinger Bands Squeeze is a volatility-based trading strategy that identifies periods of low volatility (the "squeeze") followed by explosive breakouts. When Bollinger Bands contract to their narrowest width, it signals that a big move is coming - you just need to catch the direction.
Bollinger Bands consist of three lines: a 20-day simple moving average (middle band) and two standard deviation bands above and below it. When volatility drops, the bands squeeze together. When volatility expands, price breaks out violently.
Key Insight: The tighter the squeeze, the more explosive the breakout. Squeezes lasting 20-40 days produce the best risk/reward setups.
Bollinger Bands Formula
Understanding the math behind Bollinger Bands helps you identify squeezes accurately:
Middle Band (20-day SMA)
Where P = closing price for each of the last 20 days
Standard Deviation
Measures price dispersion from the mean
Upper & Lower Bands
Lower Band = SMA - (2 × σ)
2 standard deviations capture ~95% of price action
Bandwidth (Squeeze Indicator)
Lower bandwidth = tighter squeeze = bigger breakout potential
Identifying the Squeeze
A squeeze occurs when bandwidth drops to historically low levels. Here's how to identify it:
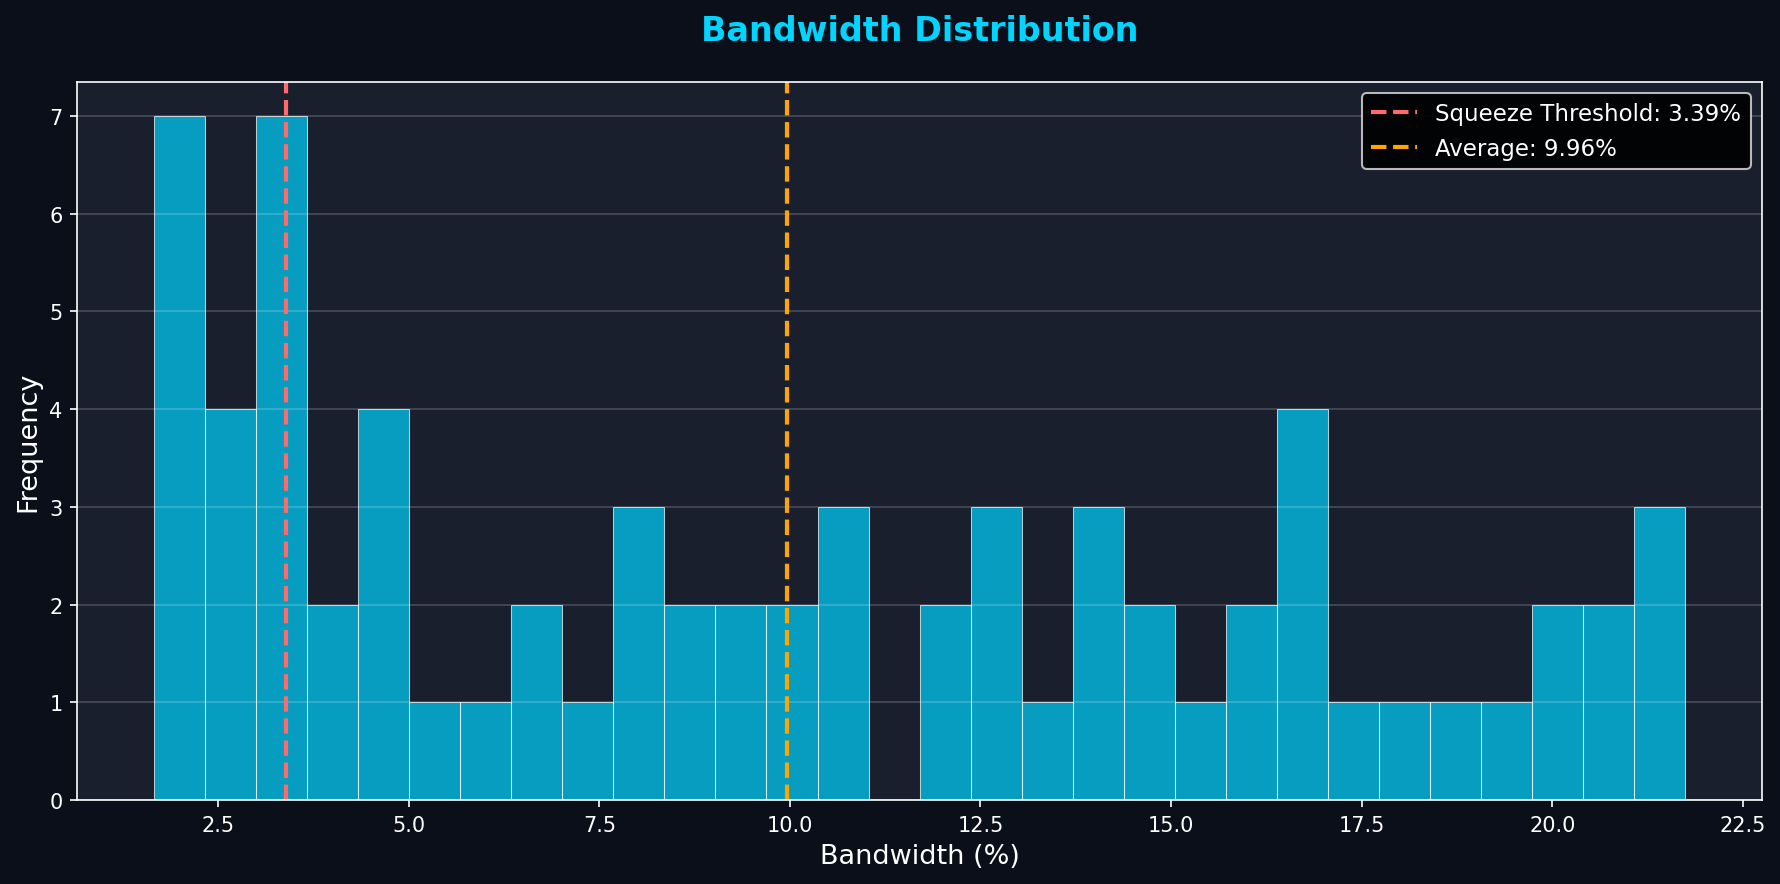
Method 1: Bandwidth Percentile
Compare current bandwidth to the last 6 months:
- Bandwidth < 25th percentile: Squeeze confirmed
- Bandwidth < 10th percentile: Extreme squeeze (best setups)
- Bandwidth > 50th percentile: Normal volatility, no squeeze
Method 2: Visual Inspection
Look for these visual cues:
- Bands are parallel and very close together
- Price oscillates in a tight range
- Volume decreases during the squeeze
- Squeeze lasts at least 15-20 days
Method 3: Bandwidth Threshold
Set absolute bandwidth thresholds:
- Bandwidth < 5%: Tight squeeze (high probability)
- Bandwidth 5-10%: Moderate squeeze
- Bandwidth > 10%: No squeeze
Trading Rule: Only trade squeezes where bandwidth is in the bottom 25% of the last 6 months. This filters out false signals.
Entry Signal: Catching the Breakout
Don't enter during the squeeze - wait for the breakout confirmation:
Entry Criteria (All Must Be Met)
- Bandwidth Squeeze: Bandwidth in bottom 25% for 15+ days
- Breakout Candle: Close outside Bollinger Band (upper or lower)
- Volume Surge: Volume 50%+ above 20-day average
- Follow-Through: Next day confirms direction (doesn't reverse)
- Momentum: RSI crosses above 50 (bullish) or below 50 (bearish)
Determining Breakout Direction
The squeeze doesn't tell you which way price will break. Use these clues:
- Trend Context: If 50-day MA is rising, favor bullish breakout
- Support/Resistance: Price near support = bullish, near resistance = bearish
- Volume Pattern: Higher volume on up days = bullish bias
- Sector Strength: If sector is strong, favor bullish breakout
Warning: Never guess the direction. Wait for the breakout to confirm, then enter on the follow-through day.
The Trade Timeline
Here's how the example trade unfolded:
Stop Loss & Position Sizing
Squeeze trades have well-defined risk. Use these rules:
Stop Loss Placement
- Bullish Breakout: Stop below squeeze low (lowest point during consolidation)
- Bearish Breakout: Stop above squeeze high
- Typical Risk: 3-6% from entry
- Max Risk: Never more than 8%
Position Sizing Formula
Example: $100k account, 2% risk = $2,000 risk budget
Entry $135.59, Stop $130.00, Risk per share = $5.59
Position Size = $2,000 / $5.59 = 358 shares
Trailing Stop Strategy
As the trade progresses, trail your stop:
- After +5% gain: Move stop to breakeven
- After +10% gain: Trail stop to +5%
- Use middle band: Exit if price closes below 20-day SMA
Exit Strategies
Know when to take profits:
Exit Signal 1: Bandwidth Expansion
When bandwidth reaches top 25% of 6-month range, the move is mature:
- Bandwidth > 75th percentile = take partial profits (50%)
- Bandwidth > 90th percentile = exit completely
Exit Signal 2: Band Touch
When price touches the opposite band:
- Bullish trade: Exit when price touches upper band + RSI > 70
- Bearish trade: Exit when price touches lower band + RSI < 30
Exit Signal 3: Time-Based
Squeeze breakouts typically last 15-40 days:
- After 30 days: Tighten stops, prepare to exit
- After 45 days: Exit regardless of profit
Common Mistakes to Avoid
- Entering During the Squeeze: Wait for the breakout. Squeezes can last months.
- Guessing Direction: Let the market tell you which way it's breaking.
- Ignoring Volume: Breakouts without volume fail 70% of the time.
- No Stop Loss: Failed breakouts reverse violently. Always use stops.
- Chasing: If you miss the entry, wait for the next squeeze. Don't chase.
- Holding Too Long: Squeeze moves are short-term. Take profits when bandwidth expands.
Key Takeaways
- • Bollinger Bands Squeeze identifies low volatility periods before explosive moves
- • Bandwidth < 25th percentile for 15+ days = valid squeeze setup
- • Wait for breakout confirmation: close outside band + volume surge + follow-through
- • Place stops below squeeze low (bullish) or above squeeze high (bearish)
- • Exit when bandwidth reaches top 25% or price touches opposite band
- • Typical hold period: 15-40 days for squeeze breakout trades
- • Risk 3-6% per trade, target 10-20% gains (2:1 to 4:1 R/R)
Get Real-Time Squeeze Alerts
MarketDly scans 500+ stocks daily for Bollinger Bands Squeeze setups. Get alerts when bandwidth drops to extreme levels and breakouts trigger.
View Pricing PlansReady to Put This Into Practice?
Join MarketDly to access real-time market insights, AI-powered analysis, and professional trading tools.
No credit card required • Free tier available • Upgrade anytime